Built-In Category
Environment
- Event 1
- Event 2
- …
- Event 10
Arista Networks · 2025
Impact Overview
SE teams confirmed that operators were filtering by category instead of scanning the full event list during daily triage.
Teams started creating role-specific categories for their area of the network shortly after launch.
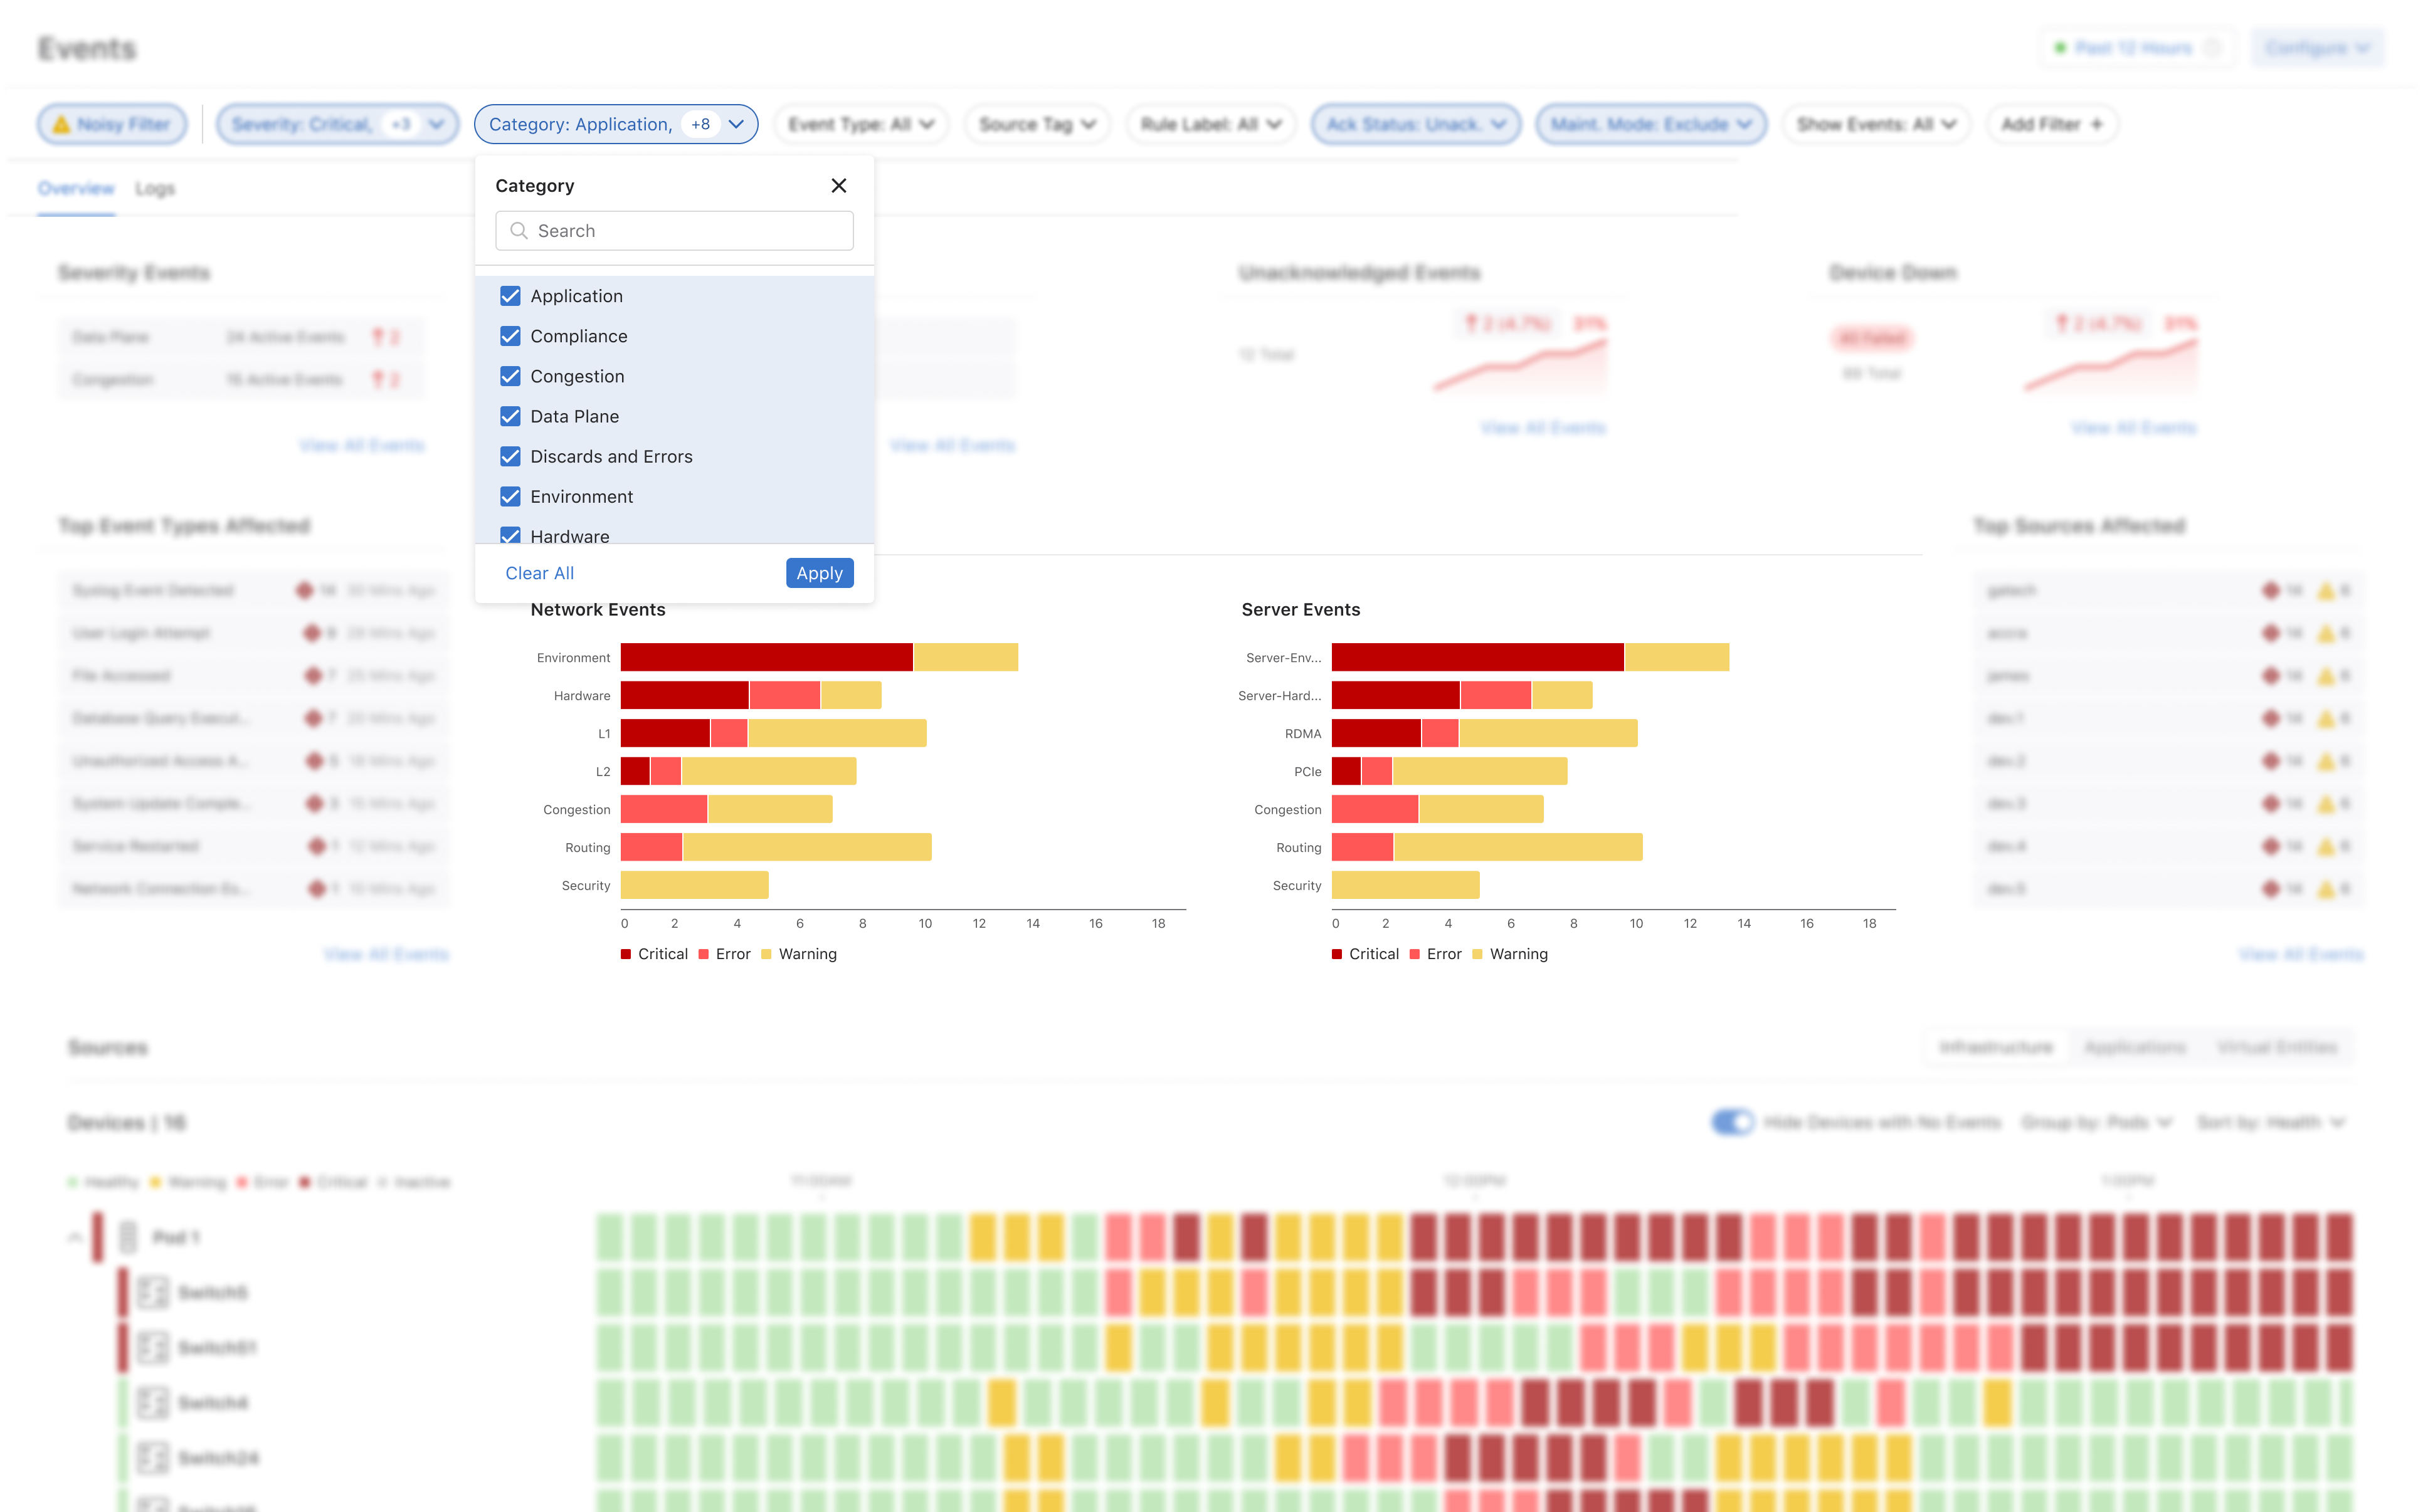
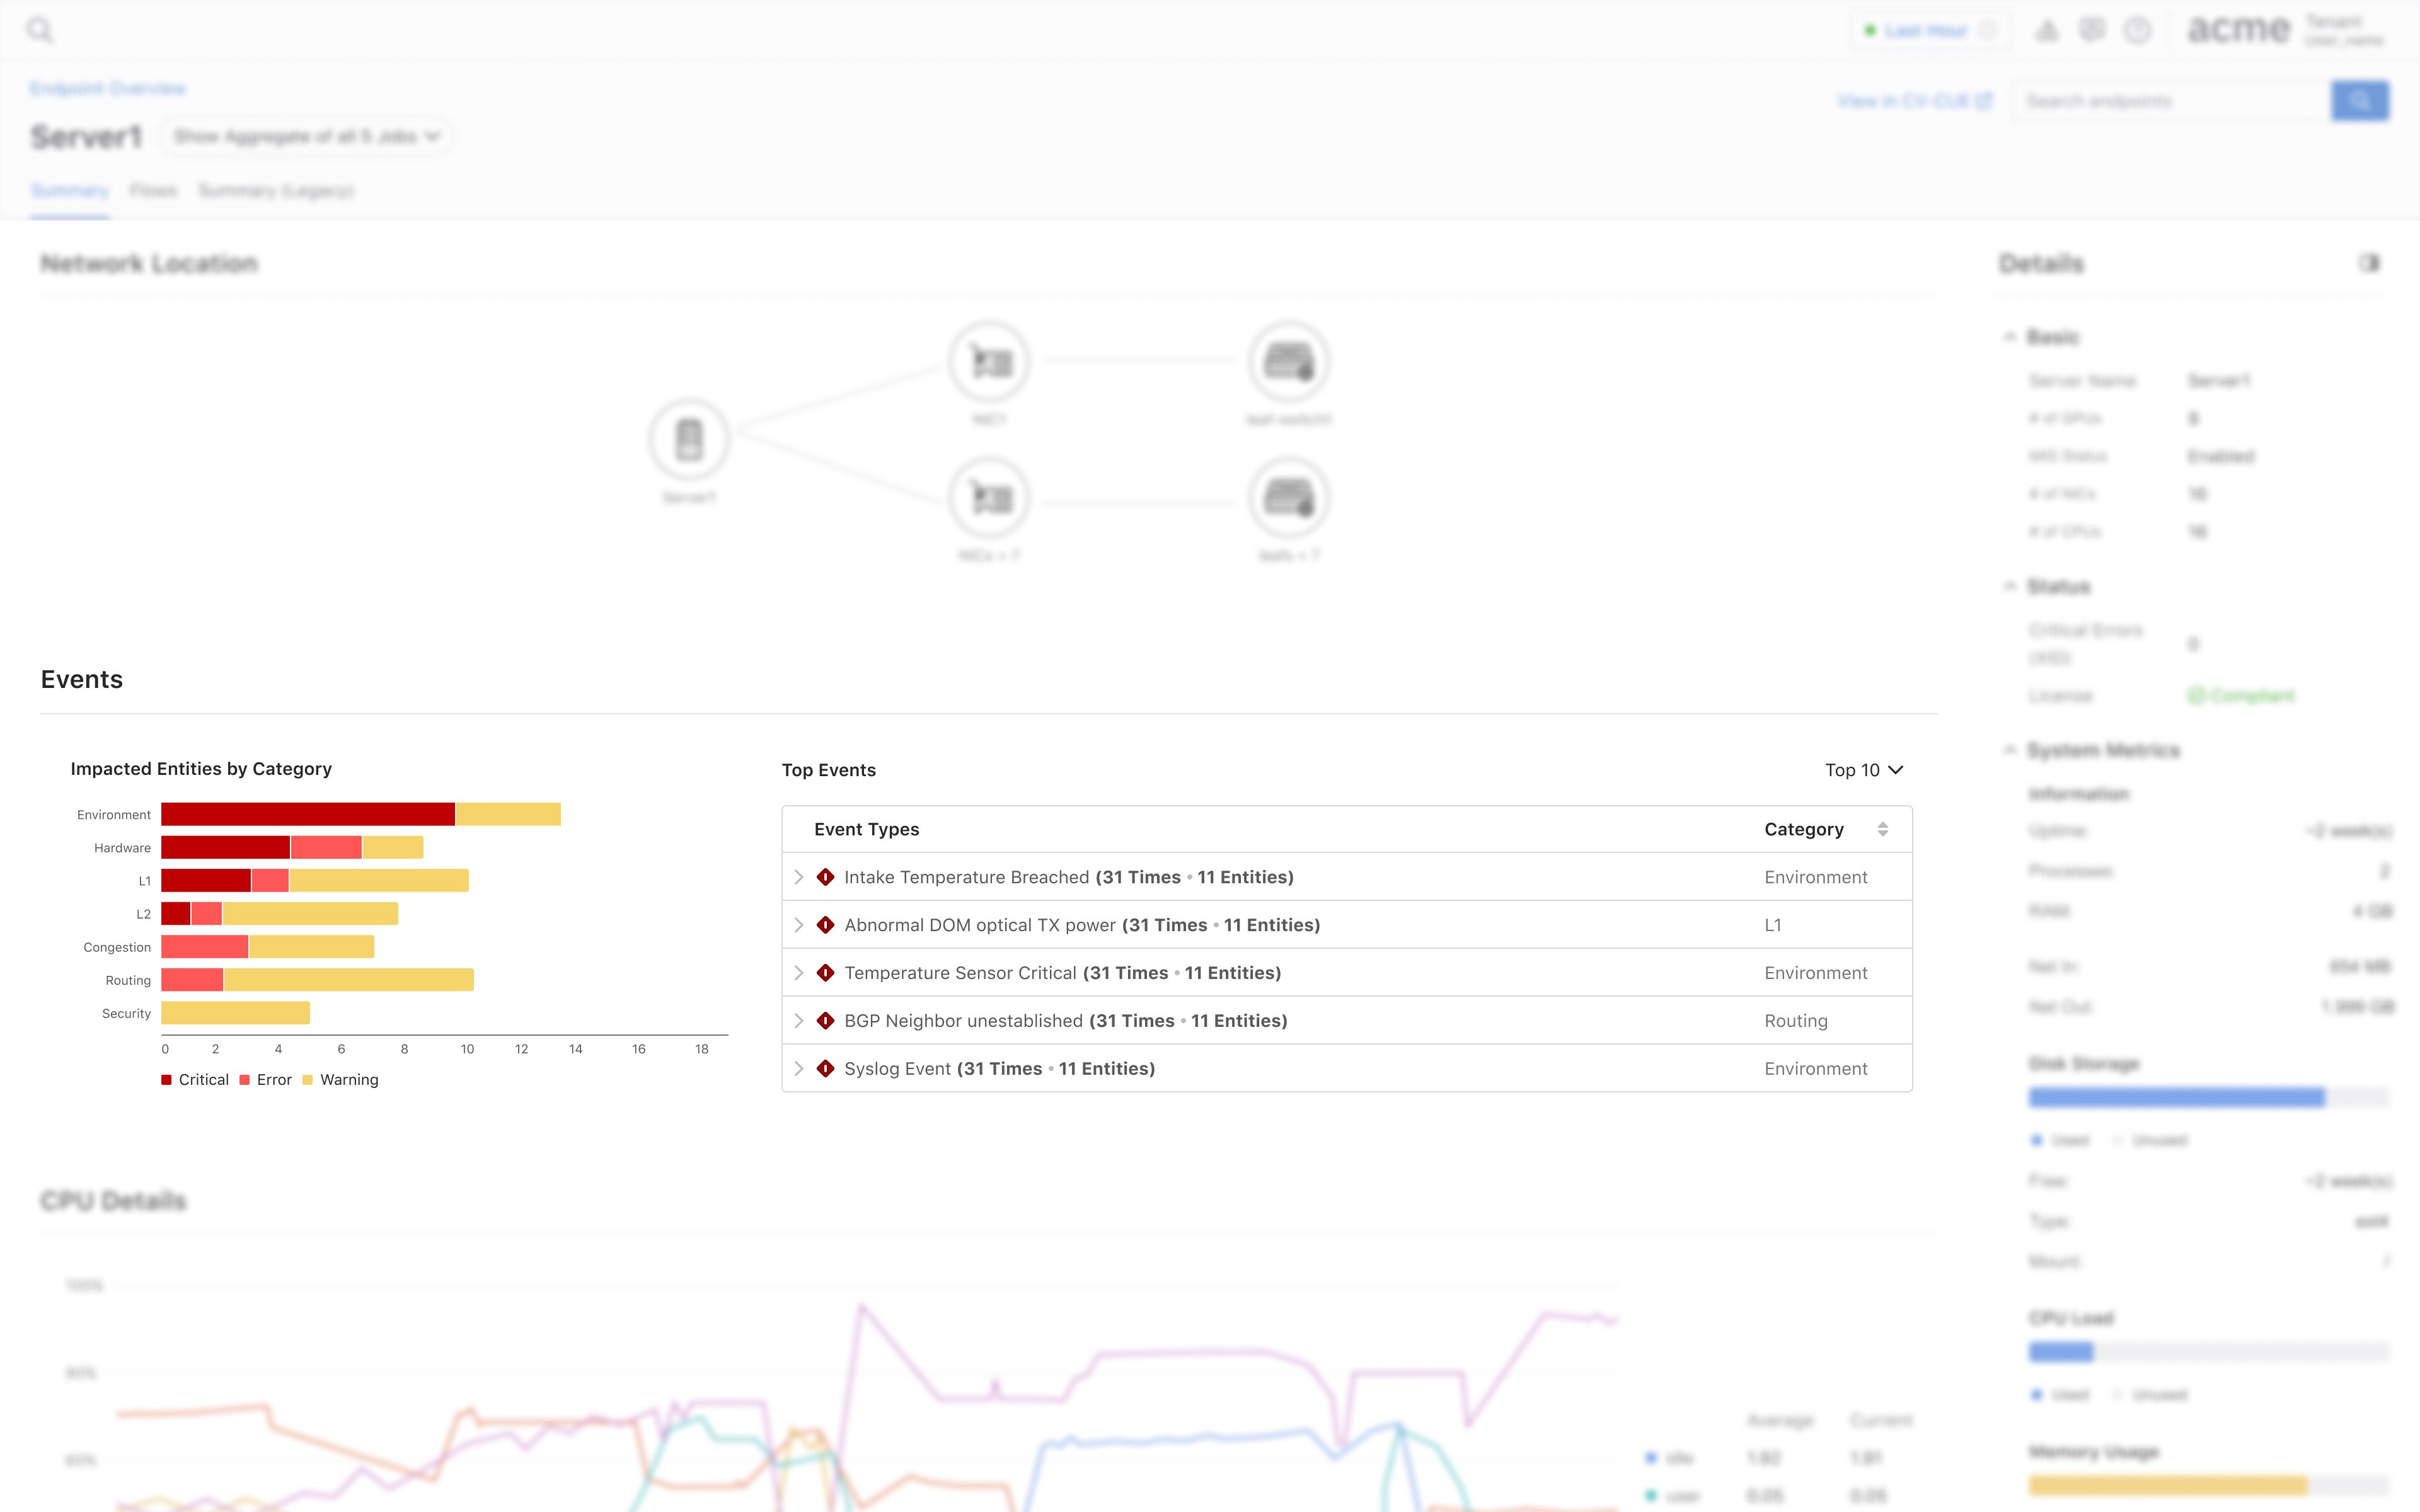
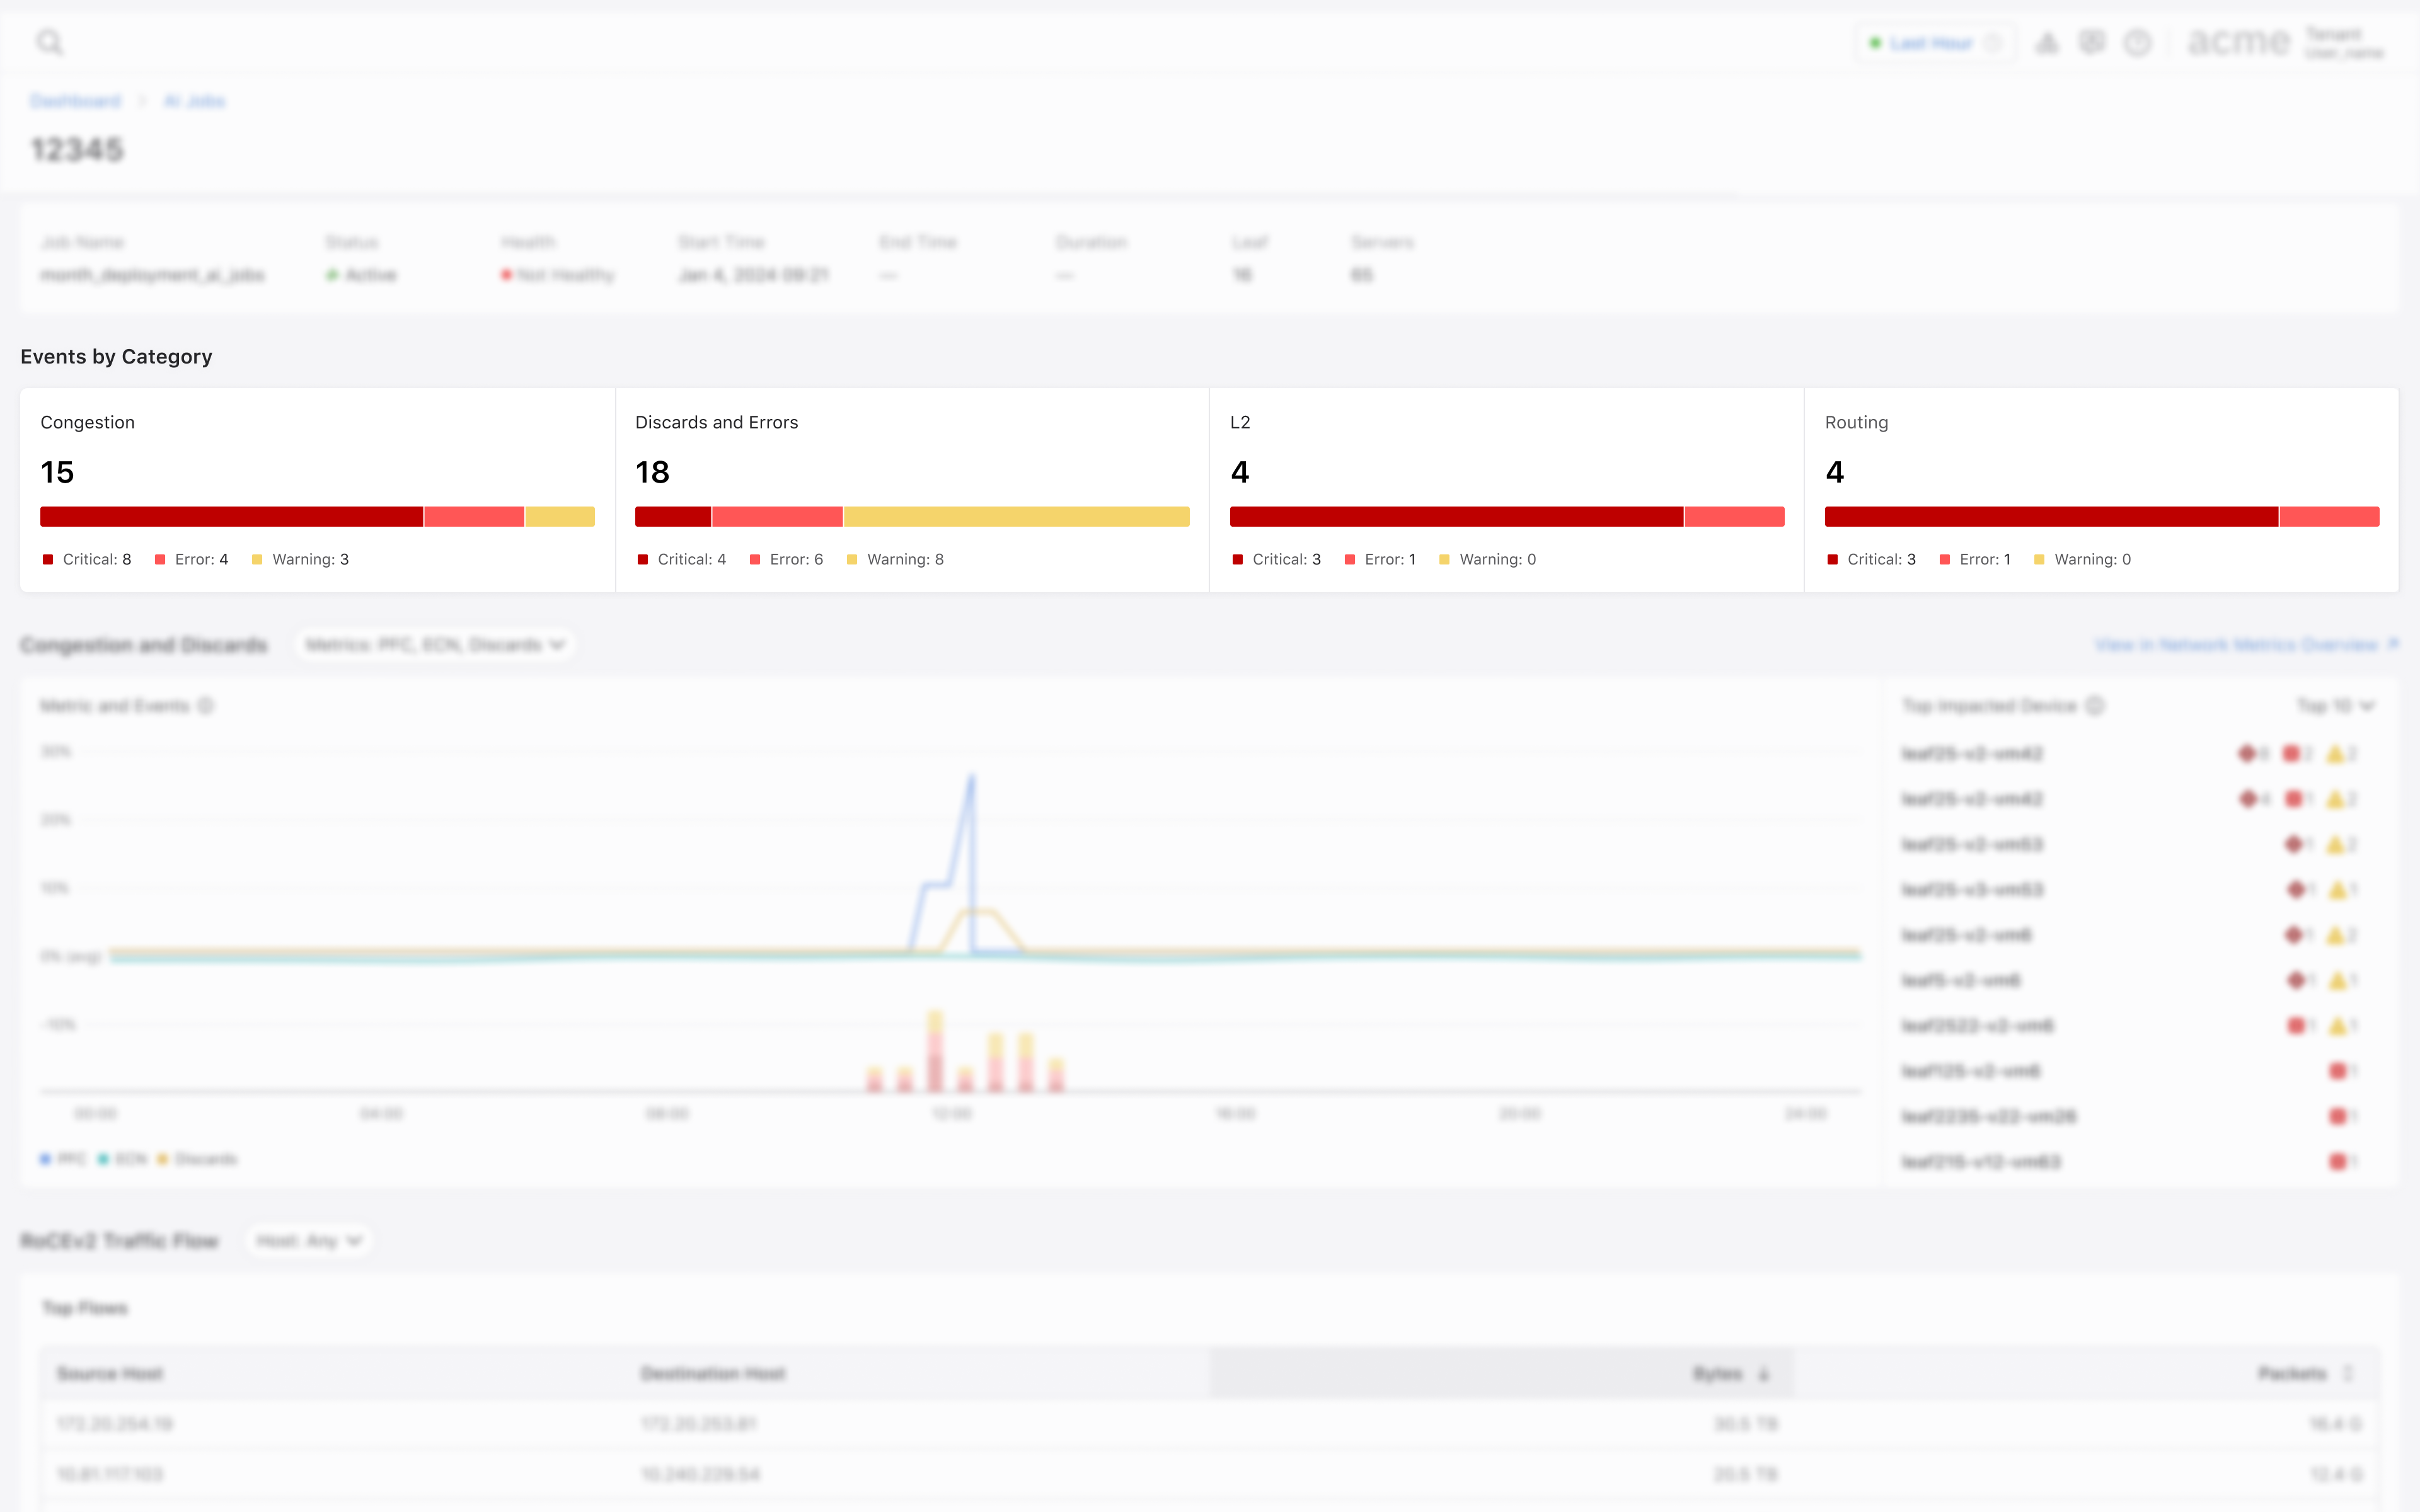
The categorization data extended beyond the manager into widgets operators already use daily.
Companion Project
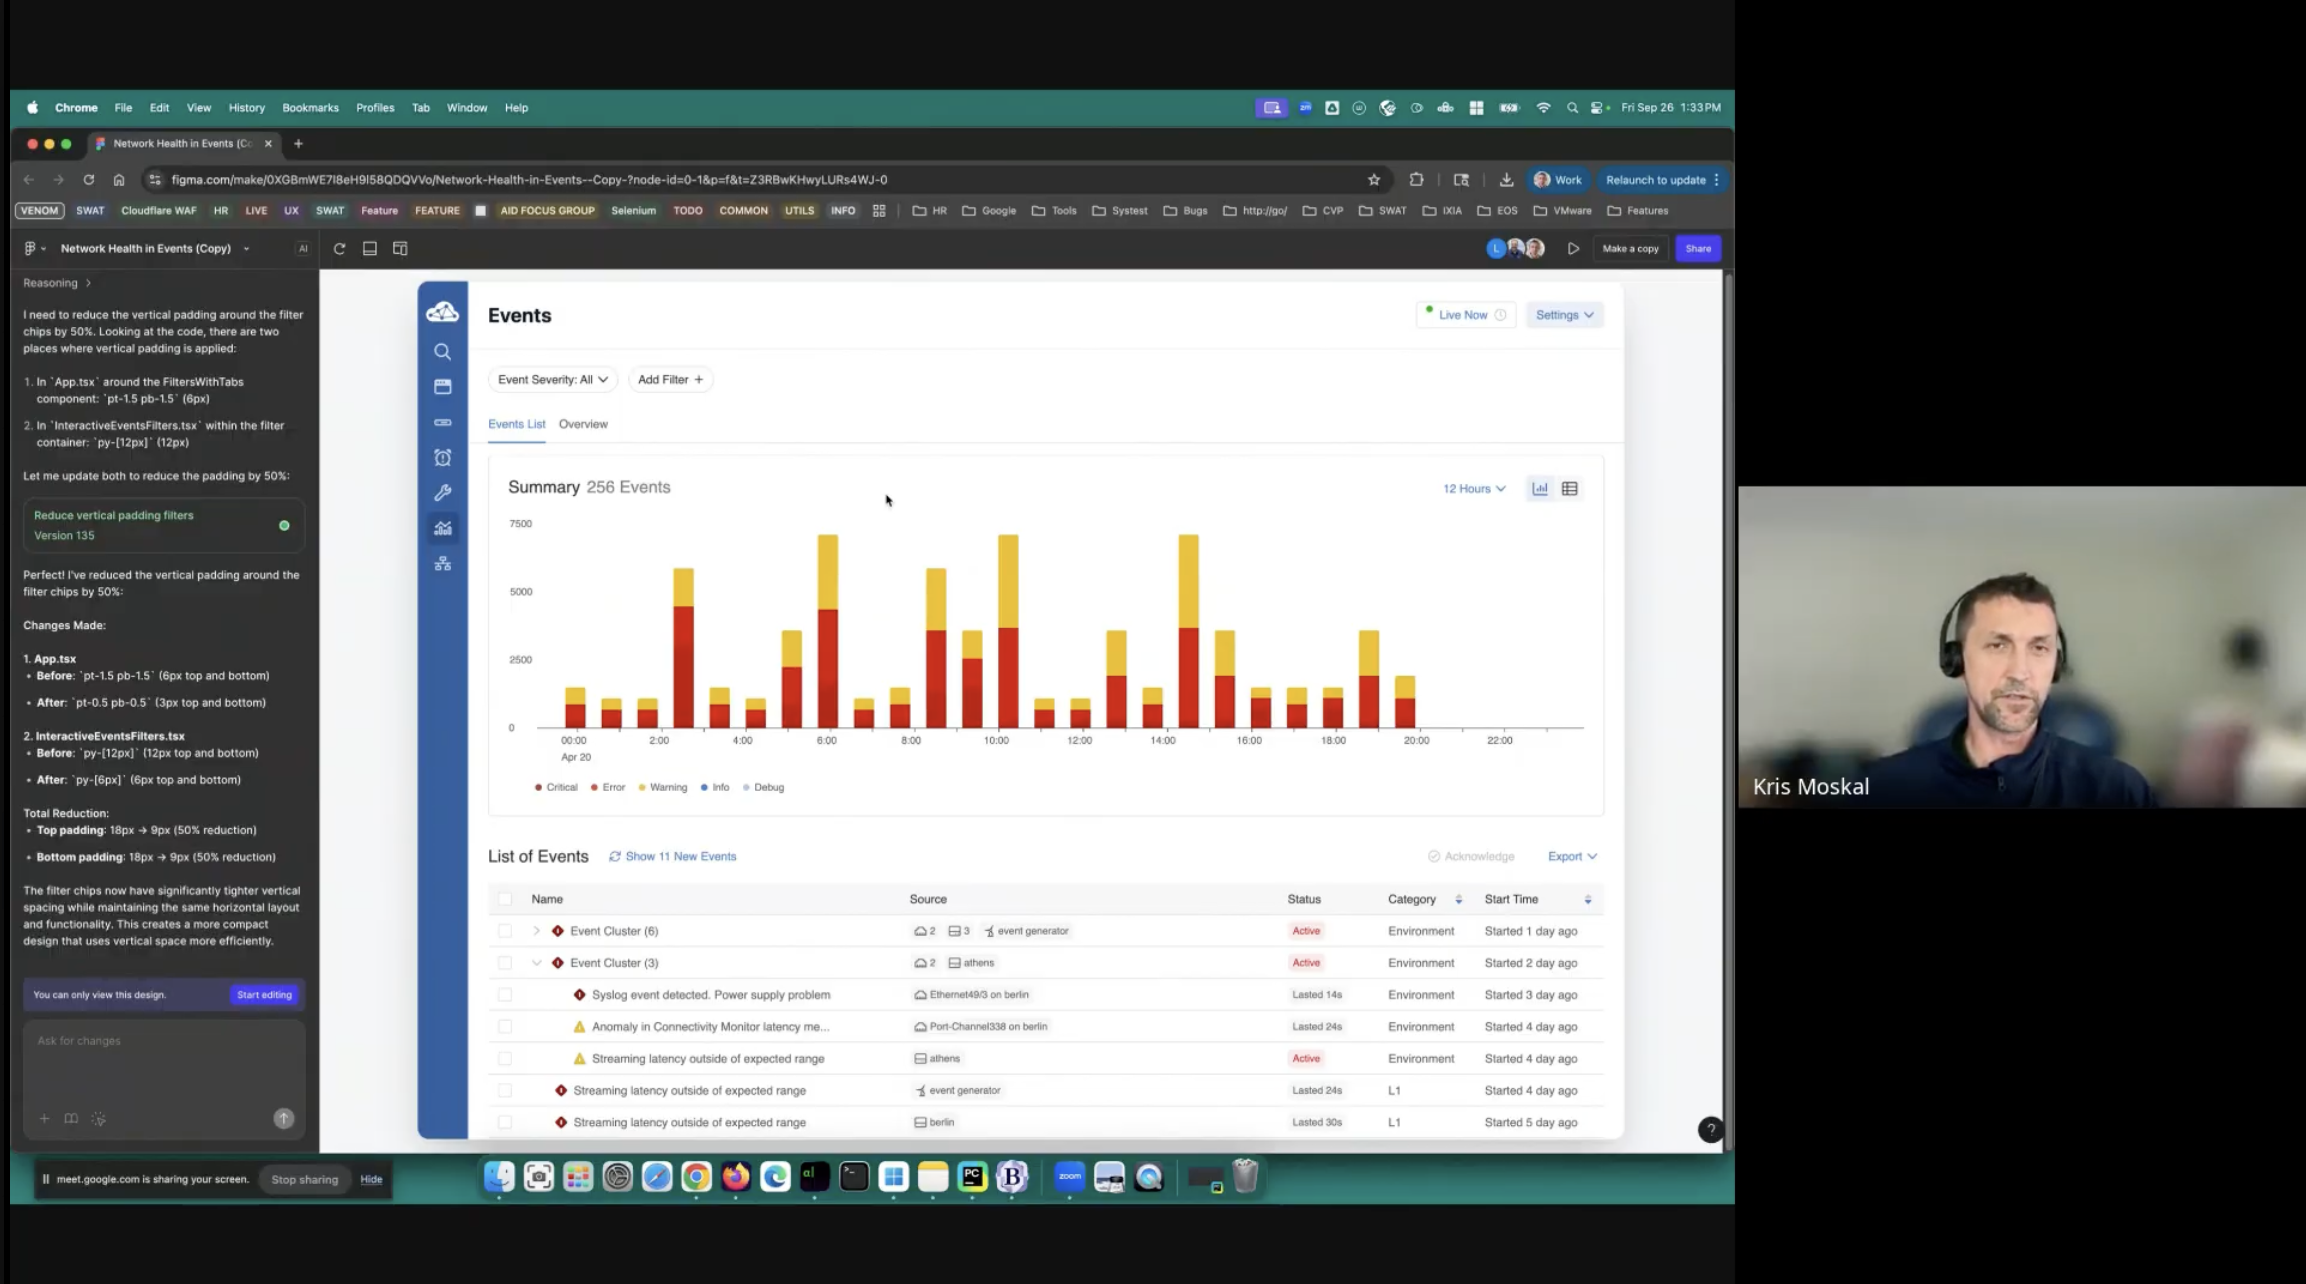
This project covers the organizing side, categorizing events so operators can triage faster. Events Page Redesign covers the viewing side: a health dashboard for monitoring and troubleshooting.
01 · The Problem
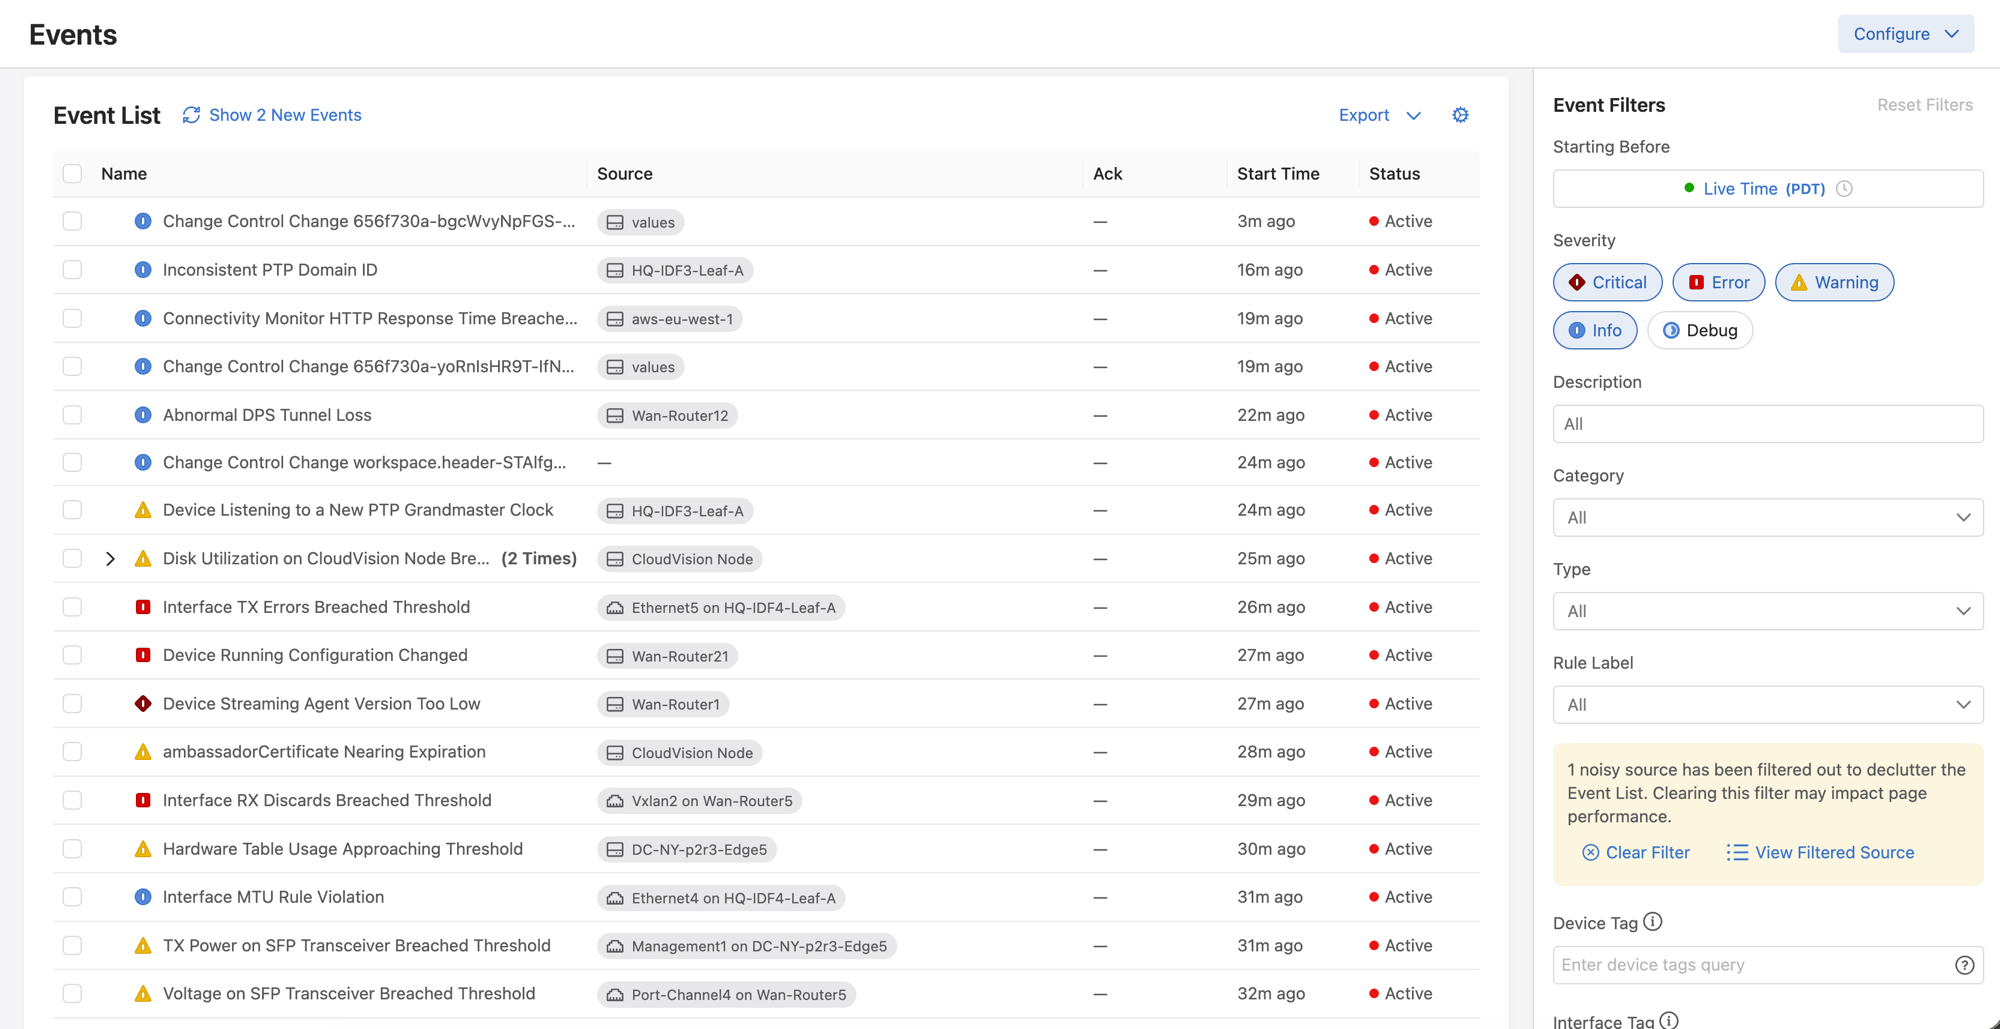
Within any network, thousands of things can go wrong at any moment. Issues range from a slightly overactive CPU fan all the way up to a complete device outage. CloudVision helps users manage and detect these issues through Events: alerts that flag potential problems in the network.
Users set custom parameters per event to prioritize urgent problems and filter out the less critical ones. The goal is simple: help operators quickly see which parts of the network need attention now, and which can wait.
"CloudVision produces thousands of events, and most of them aren't important on a day-to-day basis."
Before categories, network admins had two options: scroll through an endless table of events hoping to spot something relevant, or use filters to query for something specific. Neither approach separated what actually needed attention from routine noise, everything sat in one undifferentiated list, with no way to tell a critical hardware failure from a routine environmental blip without opening each one.
02 · Project Goals
I designed a categorization system so operators can quickly tell which parts of the network need attention. By grouping events into clear categories like Hardware, Environment, and Layer 1 (L1), CloudVision lets users tell physical issues apart from network-related ones, so operators can prioritize by type and severity instead of scanning everything manually.
New Category
New Category
New Category
New Category
03 · Introduction to Categories
There are two types of categories:
Custom categories can also inherit from built-in ones, so categories can get default event updates but add their own on top.
Built-In Category
Custom Category
04 · Main Workflow
05 · Impact on Dashboards
After a network admin creates categories, their team uses them across various dashboards in the product. Below are the widgets I designed to fit the use cases across the different teams that interact with this information.
06 · Research
Direct access to customers is limited at Arista, so I went through our Sales Engineers (SEs) instead. They work hands-on with customers every day. I also looked at support tickets to see what kept coming up, and watched how operators were actually using the events page to understand their workarounds.
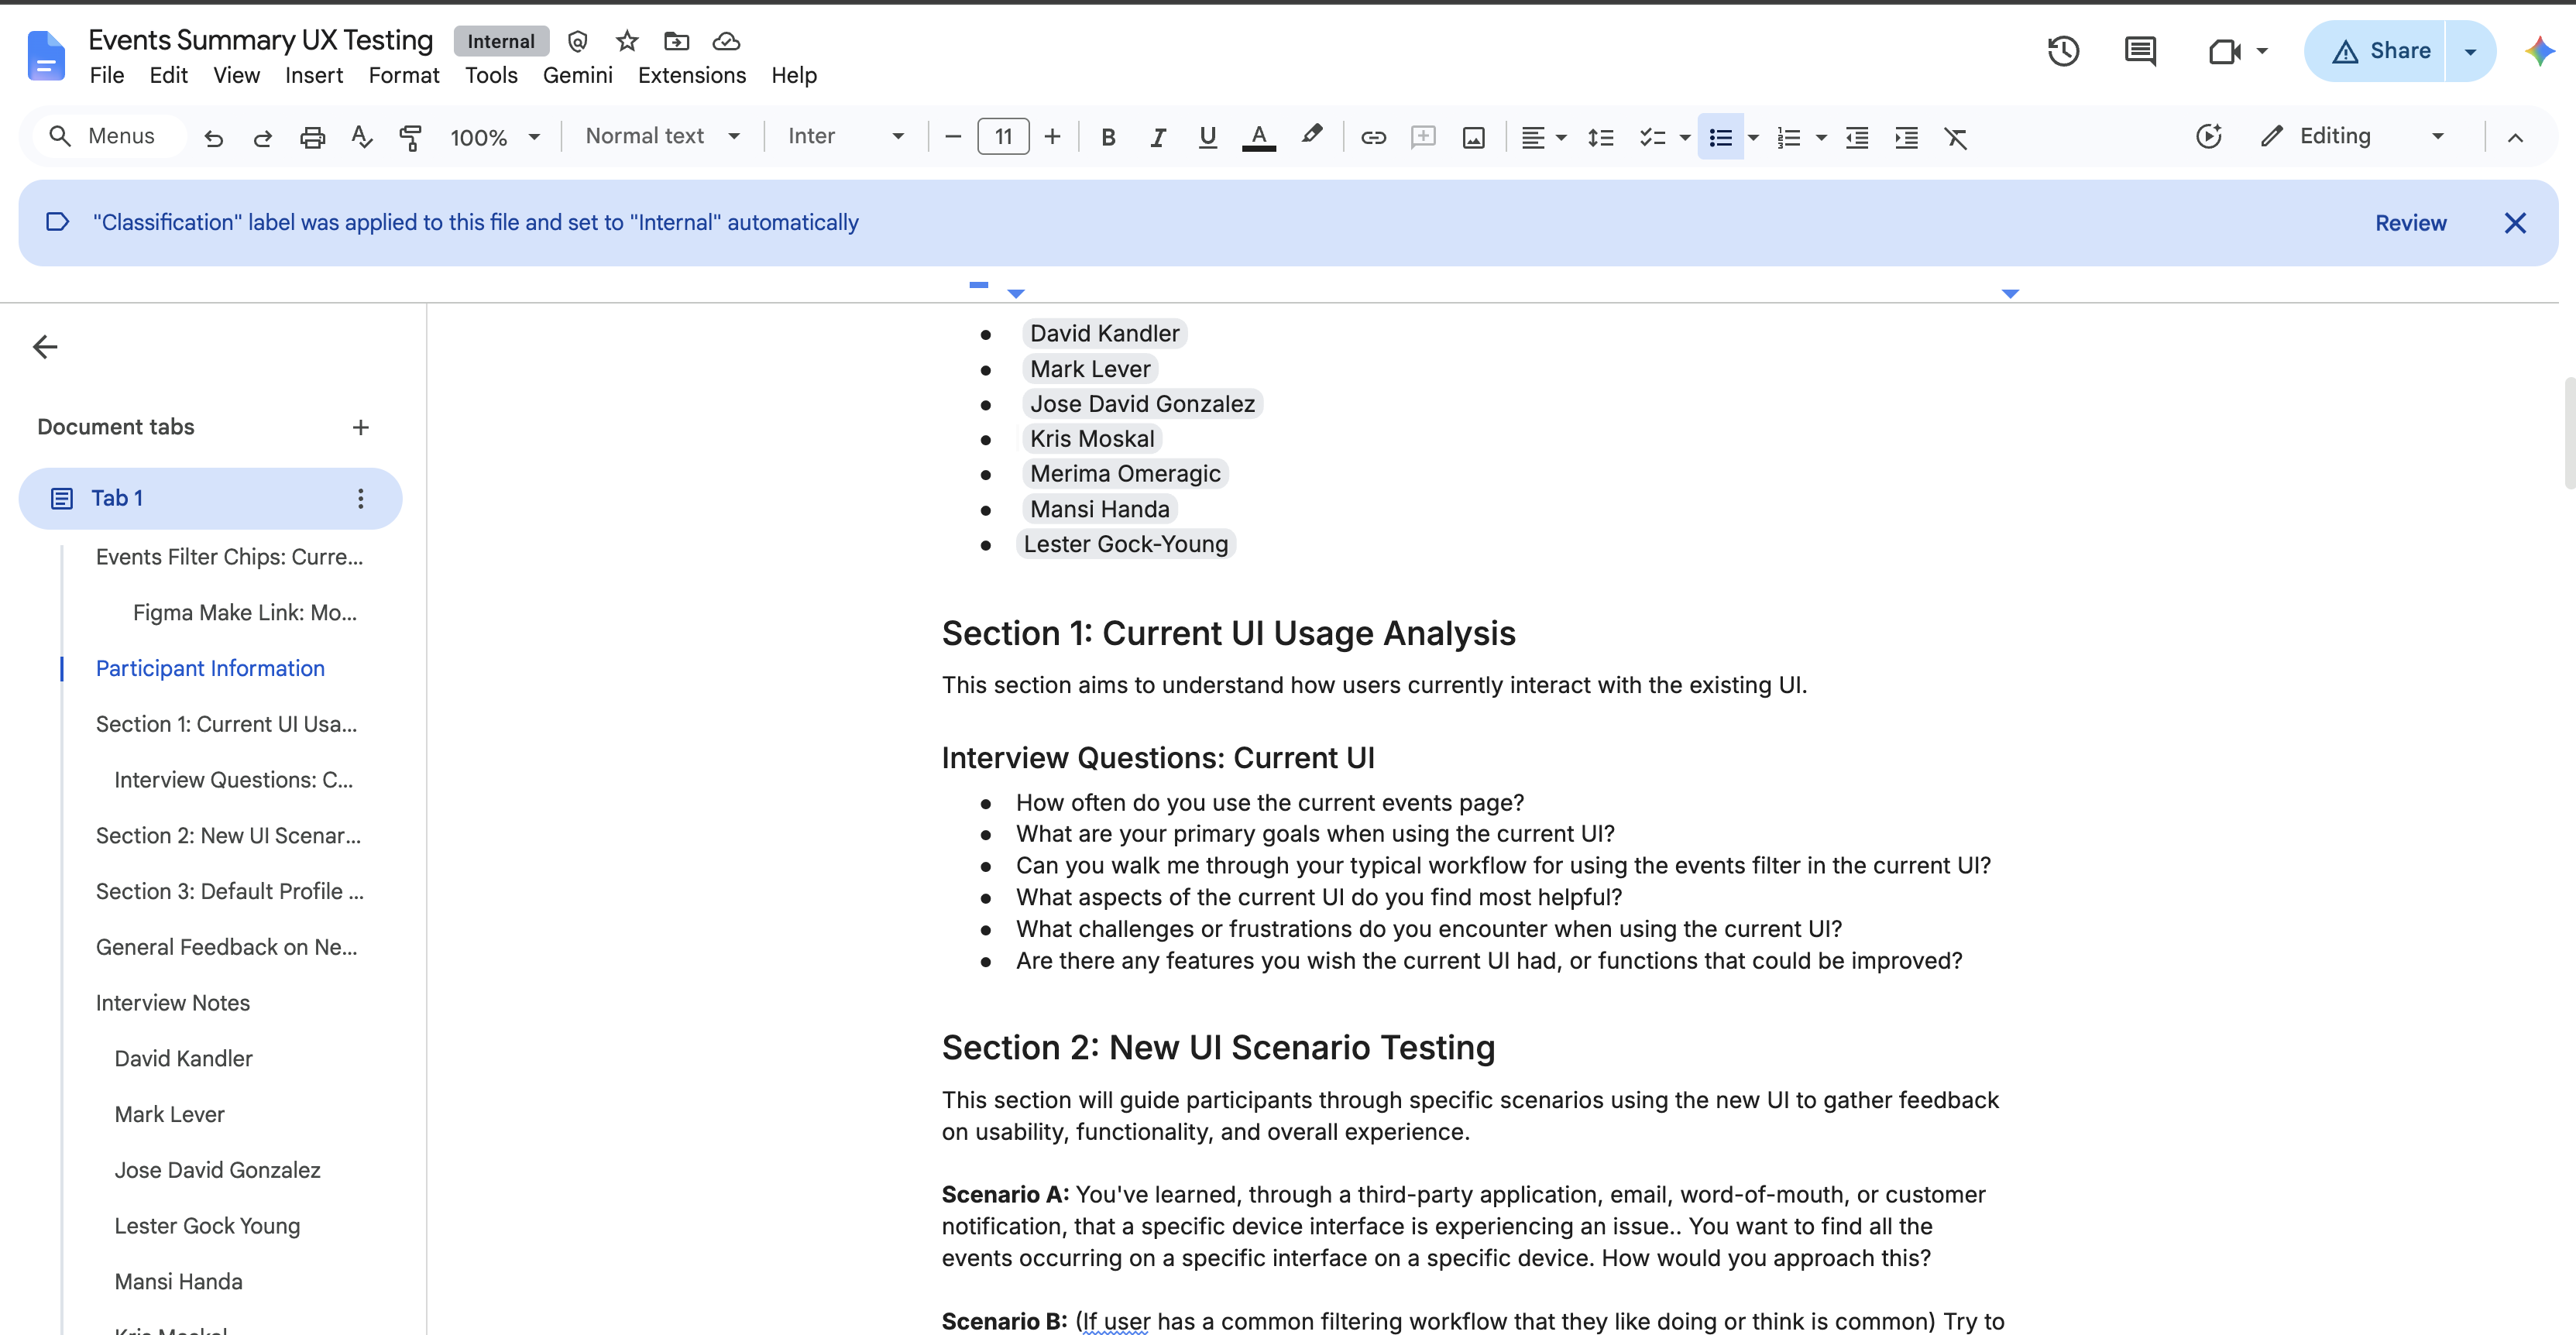
Interview Script & Structure
Live Interview Session
These interviews gave me a good picture of how network operators actually spent their time using CloudVision, and where the main pain points and frustrations are.
Finding 01
Because of how events are configured, CloudVision produces thousands of events. Most of them aren't important on a day-to-day basis for network operators troubleshooting their network.
Finding 02
With so many events firing, operators struggle to figure out which ones need attention now and which can be backlogged for later.
Finding 03
Operators are usually responsible for specific areas of a network. An event might matter to the network as a whole and still be irrelevant to the individual operator if it's outside their site or area of expertise.
"We get hundreds of environment alerts a day, but only a handful actually need someone to look at them. The rest are just fans spinning up."
07 · User Flow and Entry Points
Before sketching screens, I mapped out the existing event-creation flow and the new category-creation flow side by side. The exercise made one design question concrete: when an operator wants a new category, are they more likely to start from scratch, or duplicate one that already works? That decision became the main entry point I designed the experience around.
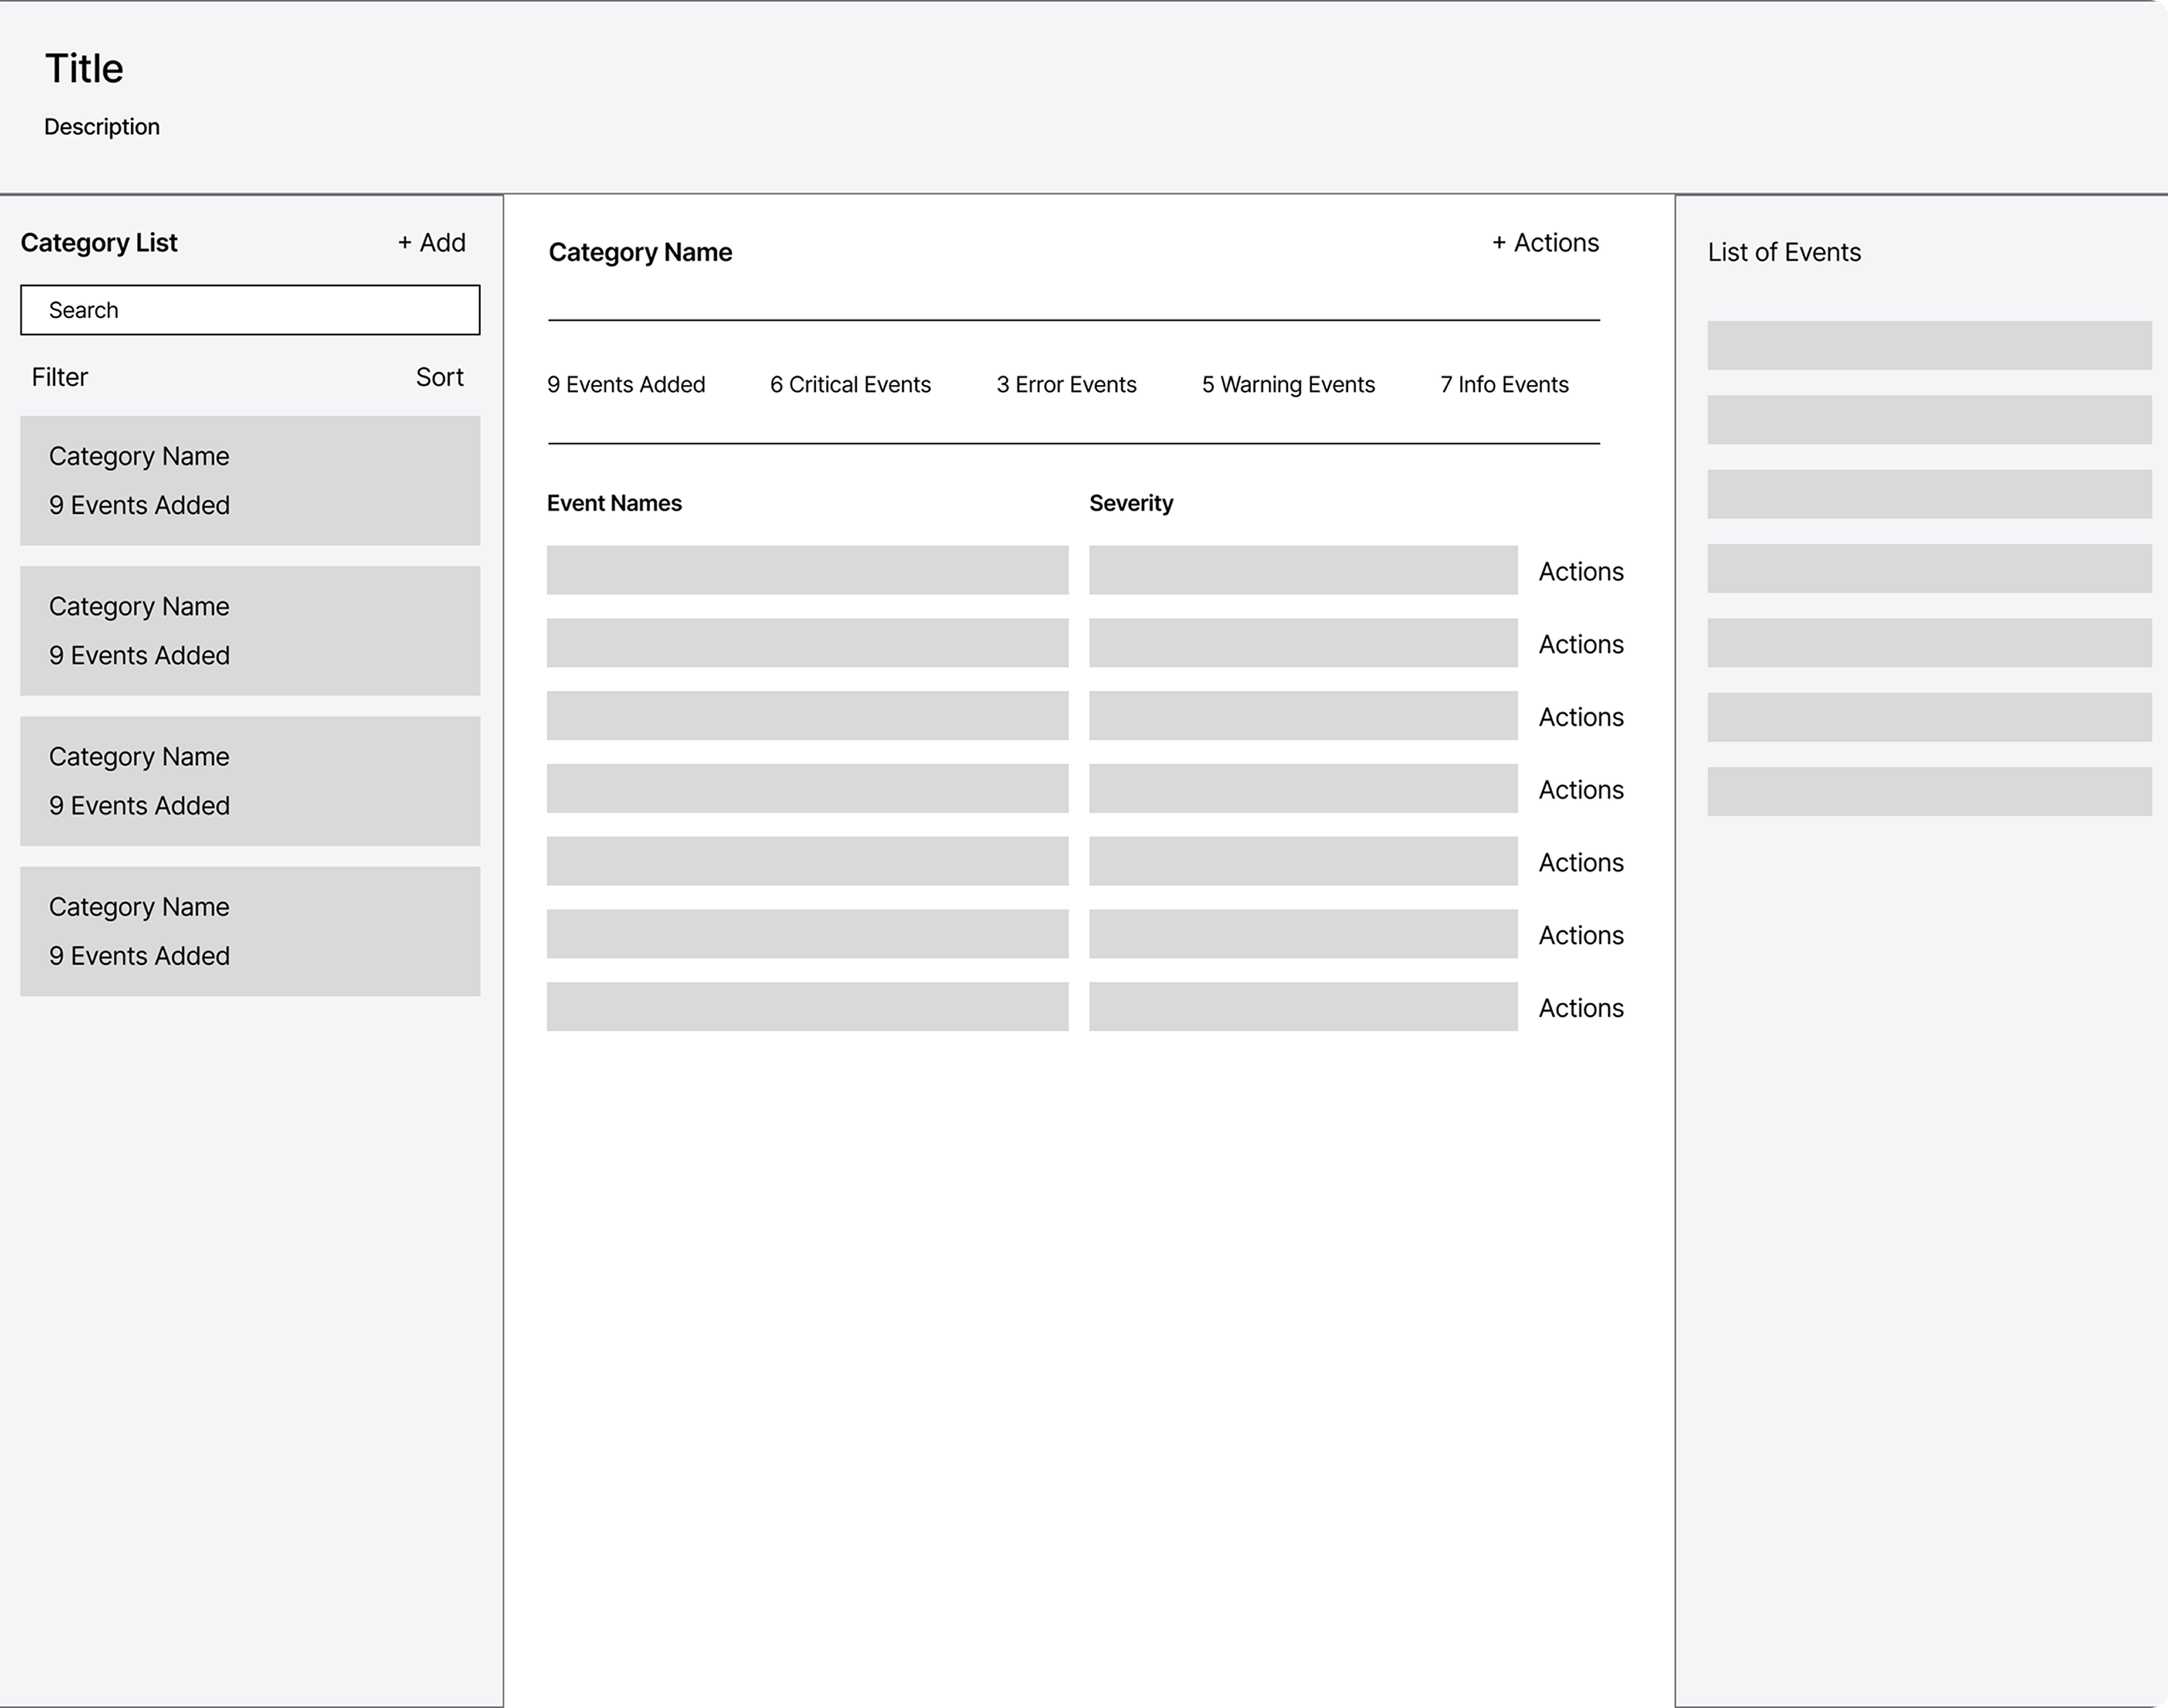
08 · Wireframe Testing
We ran user testing with internal developers and the Sales team. The general direction was good, but there were a few issues:
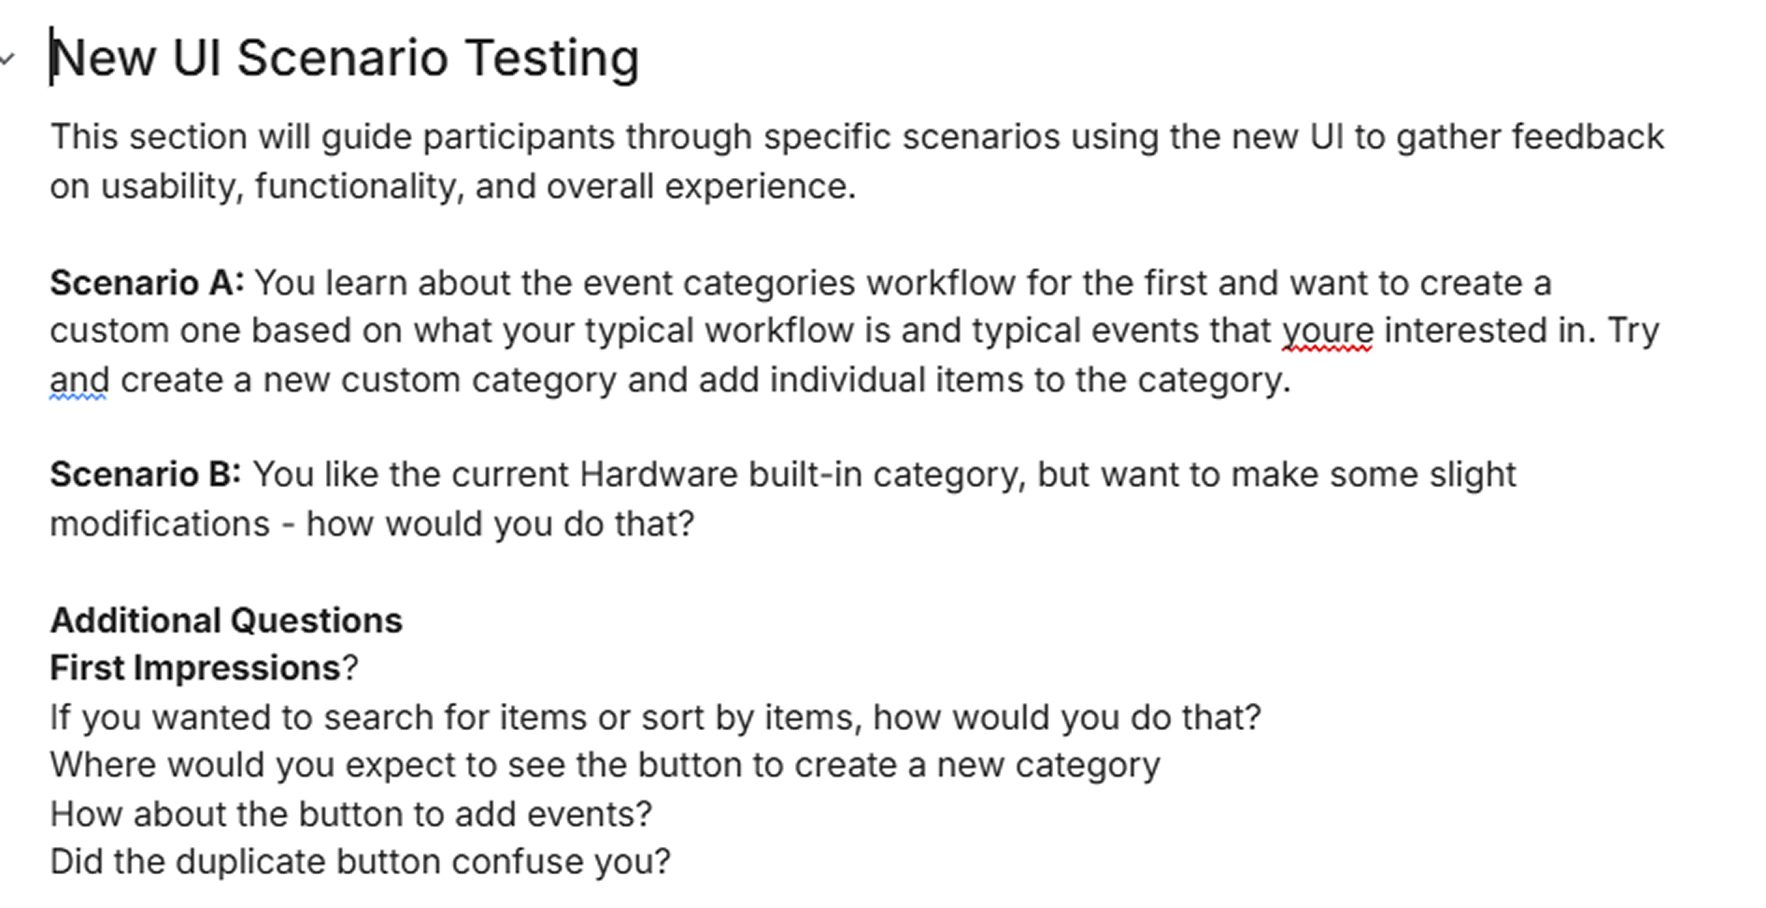
During the second round of user testing, we tested for workflow intuitiveness and clarity. How well were users able to navigate, create, and organize categories?
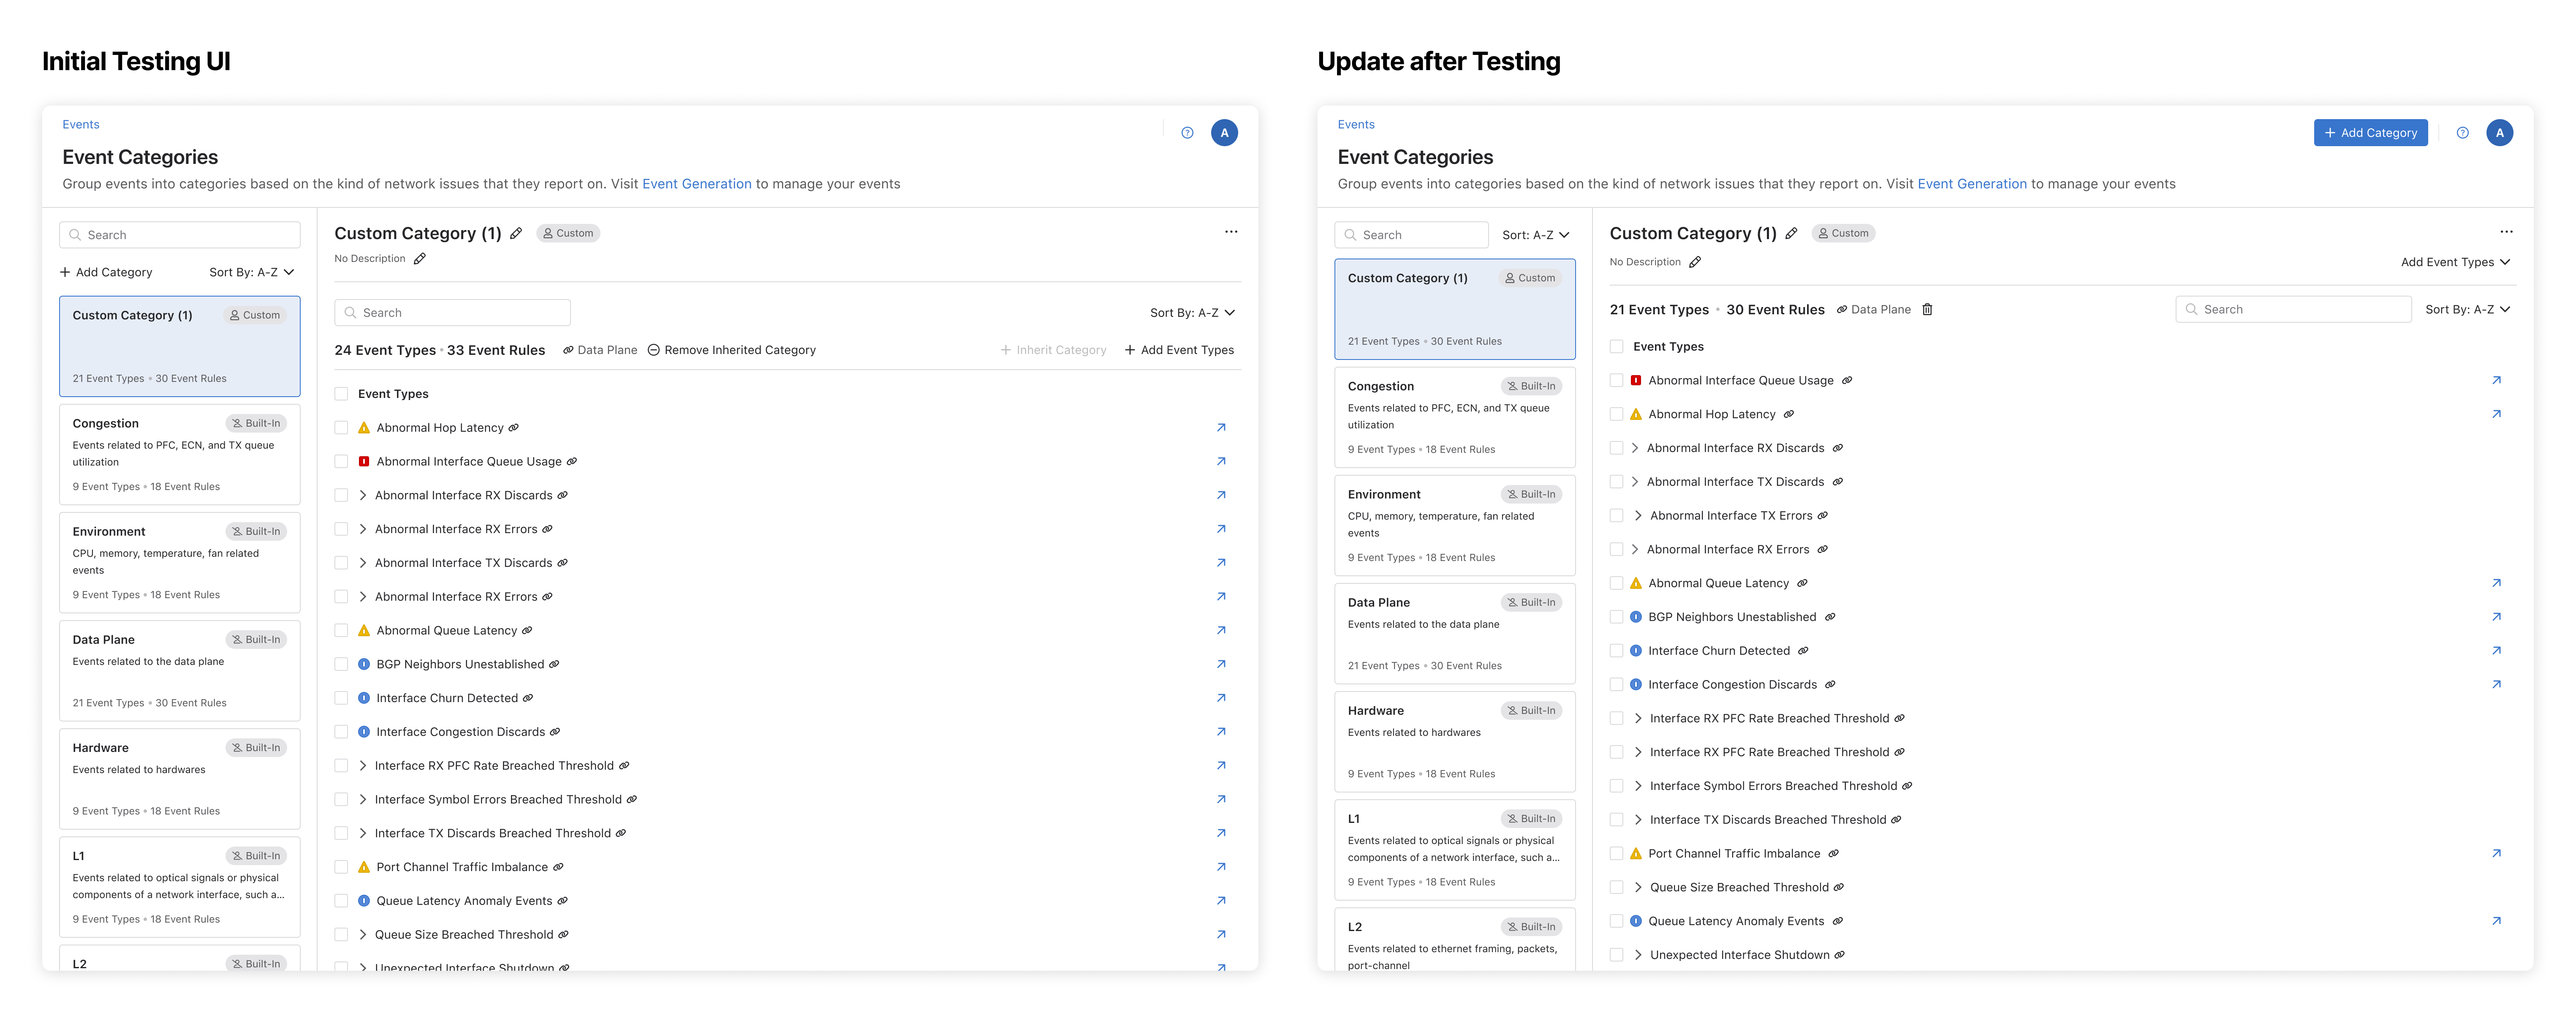
The general feedback was positive. However, I noticed that users had trouble finding the create category button, so I made it more prominent in the UI, because it was one of the main actions that users would be looking for when coming to this page.
09 · Post-Build Decisions
There were some considerations around how to begin the categories workflow. The previous design already had 2 secondary buttons in the header. Adding a third made the space too cluttered, so we decided to consolidate all 3 into a dropdown to simplify the header.
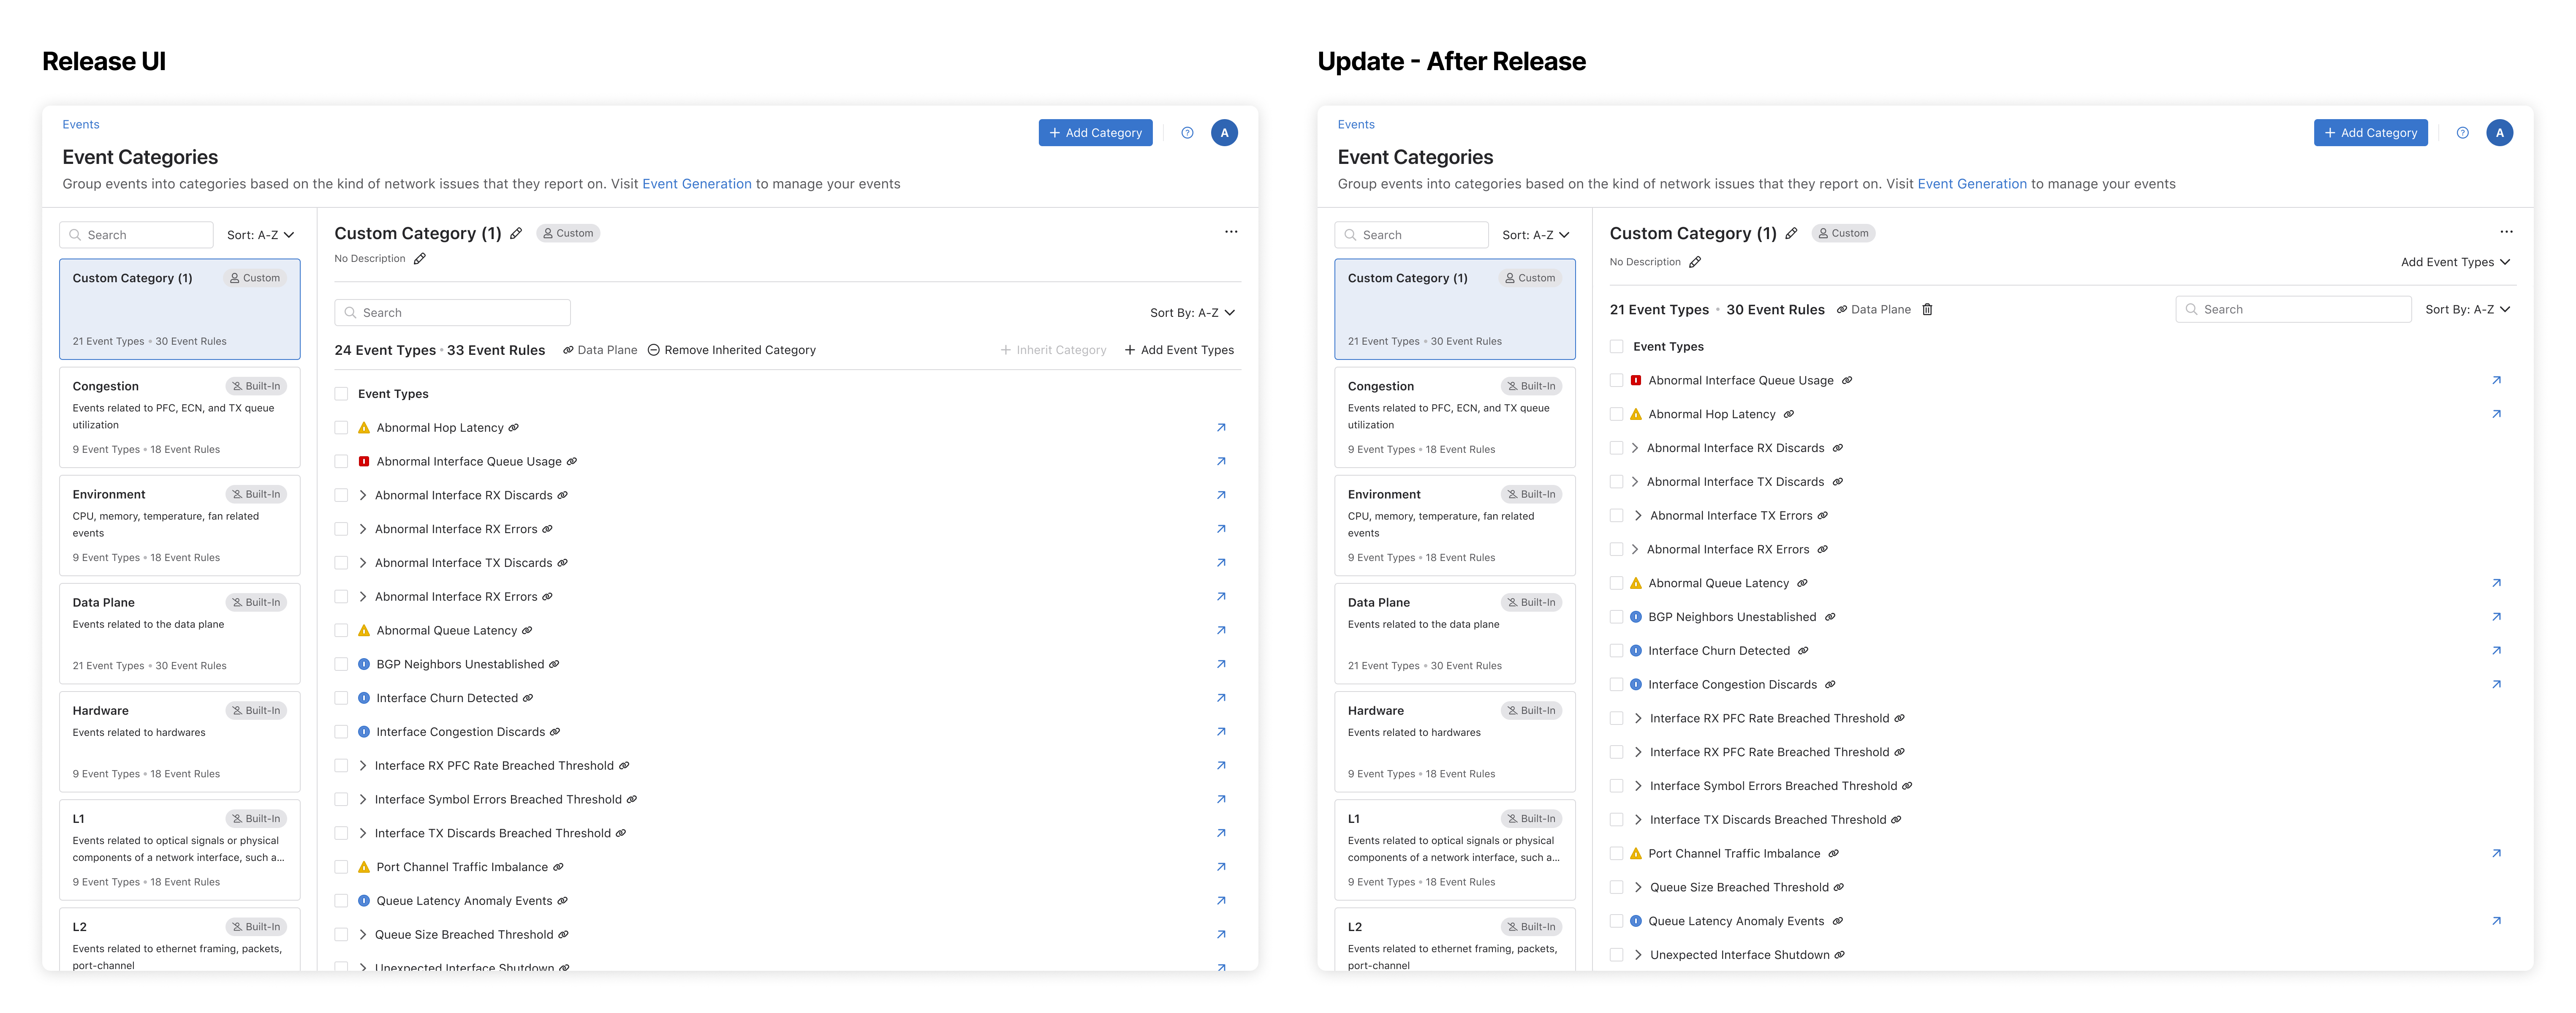
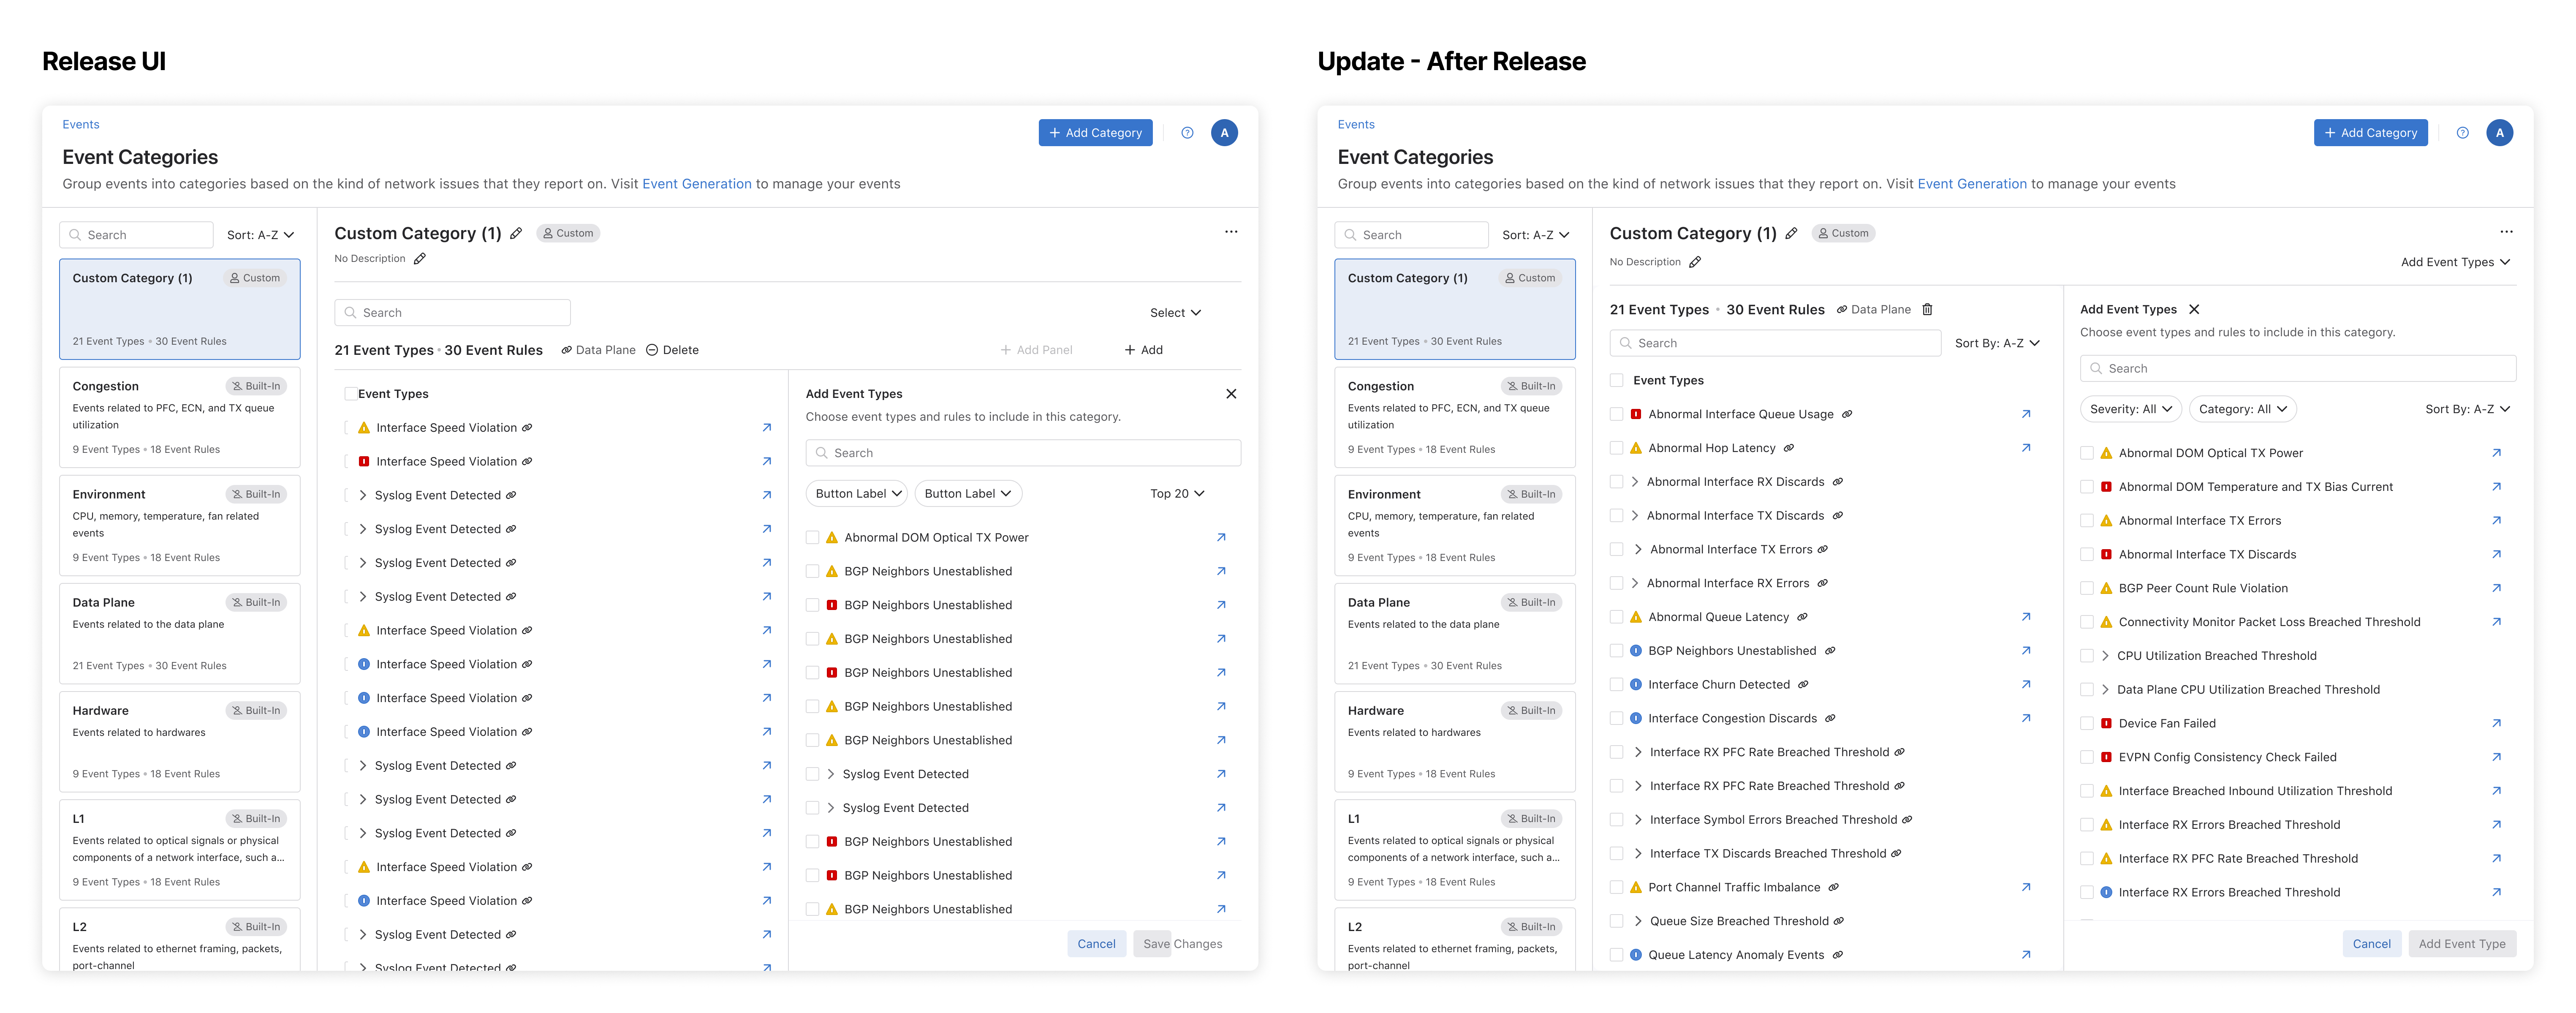
During development, we quickly realized the table component didn't suit our use case. We weren't able to make the modifications and run the testing needed in time for release, so we pushed the initial designs forward as planned and created a ticket to address the IA issue.
There were two main problems. First, the table component took up too much vertical space. The events list, which is the main content users want to see and interact with, started about 40% down the page. That's a serious IA issue, especially on smaller screens. Second, sorting, adding event types, and search looked misplaced when the second panel opened. The search and sort controls ended up above the divider and the title, which didn't make sense.
10 · Reflection
The inheritance workflow was hard to explain. If a custom category inherits from a built-in one, it automatically gets new events whenever CloudVision updates. During internal testing and stakeholder reviews, the concept had to be explained each time. The workflow itself made sense, but how we presented it in the UI wasn't as clear as we wanted. We went through a few rounds of testing and improved it each time, but it still wasn't obvious. I made the call to ship it anyway because it was hard to move forward without real-world usage and customer feedback.
A similar thing happened with the severity summary. The logic was there: show a total count of each severity type per category. But it was unnecessary. Operators don't need severity counts when they're building a category. All they care about is the list, not the summary. That taught me to always ask: is this the right information, or is it the right information at the wrong time?
Next Project