Arista Networks · 2025–2026
Events Page Redesign
- Overview
- Redesigned the landing page of the Events page in CloudVision.
- Role
- Lead UX Designer
- Timeline
- 2025–2026
(6 months) - Team
- 1 Designer
1 PM
6 Engineers - Tools
- Figma
Impact Overview
Adoption Rate
SEs reported back that most customers found the new dashboard far more useful for spotting key issues on the network.
Triage Speed
Sales reported most customers used the dashboard metrics as their starting point for triage, instead of digging through filters first.
Companion Project
See how operators organize these events →
This project covers the viewing side, a health dashboard for monitoring and troubleshooting. Event Categories covers the organizing side: how operators group and label events in the first place.
01 · The Problem
Visualizing network health at a glance.
After shipping Event Categories, the next goal was to provide a dashboard to help operators see network health at a glance from the events POV. We received countless reports from users and from the support team that users would ideally prefer a holistic view of their network to begin troubleshooting, rather than a simple history chart and table.
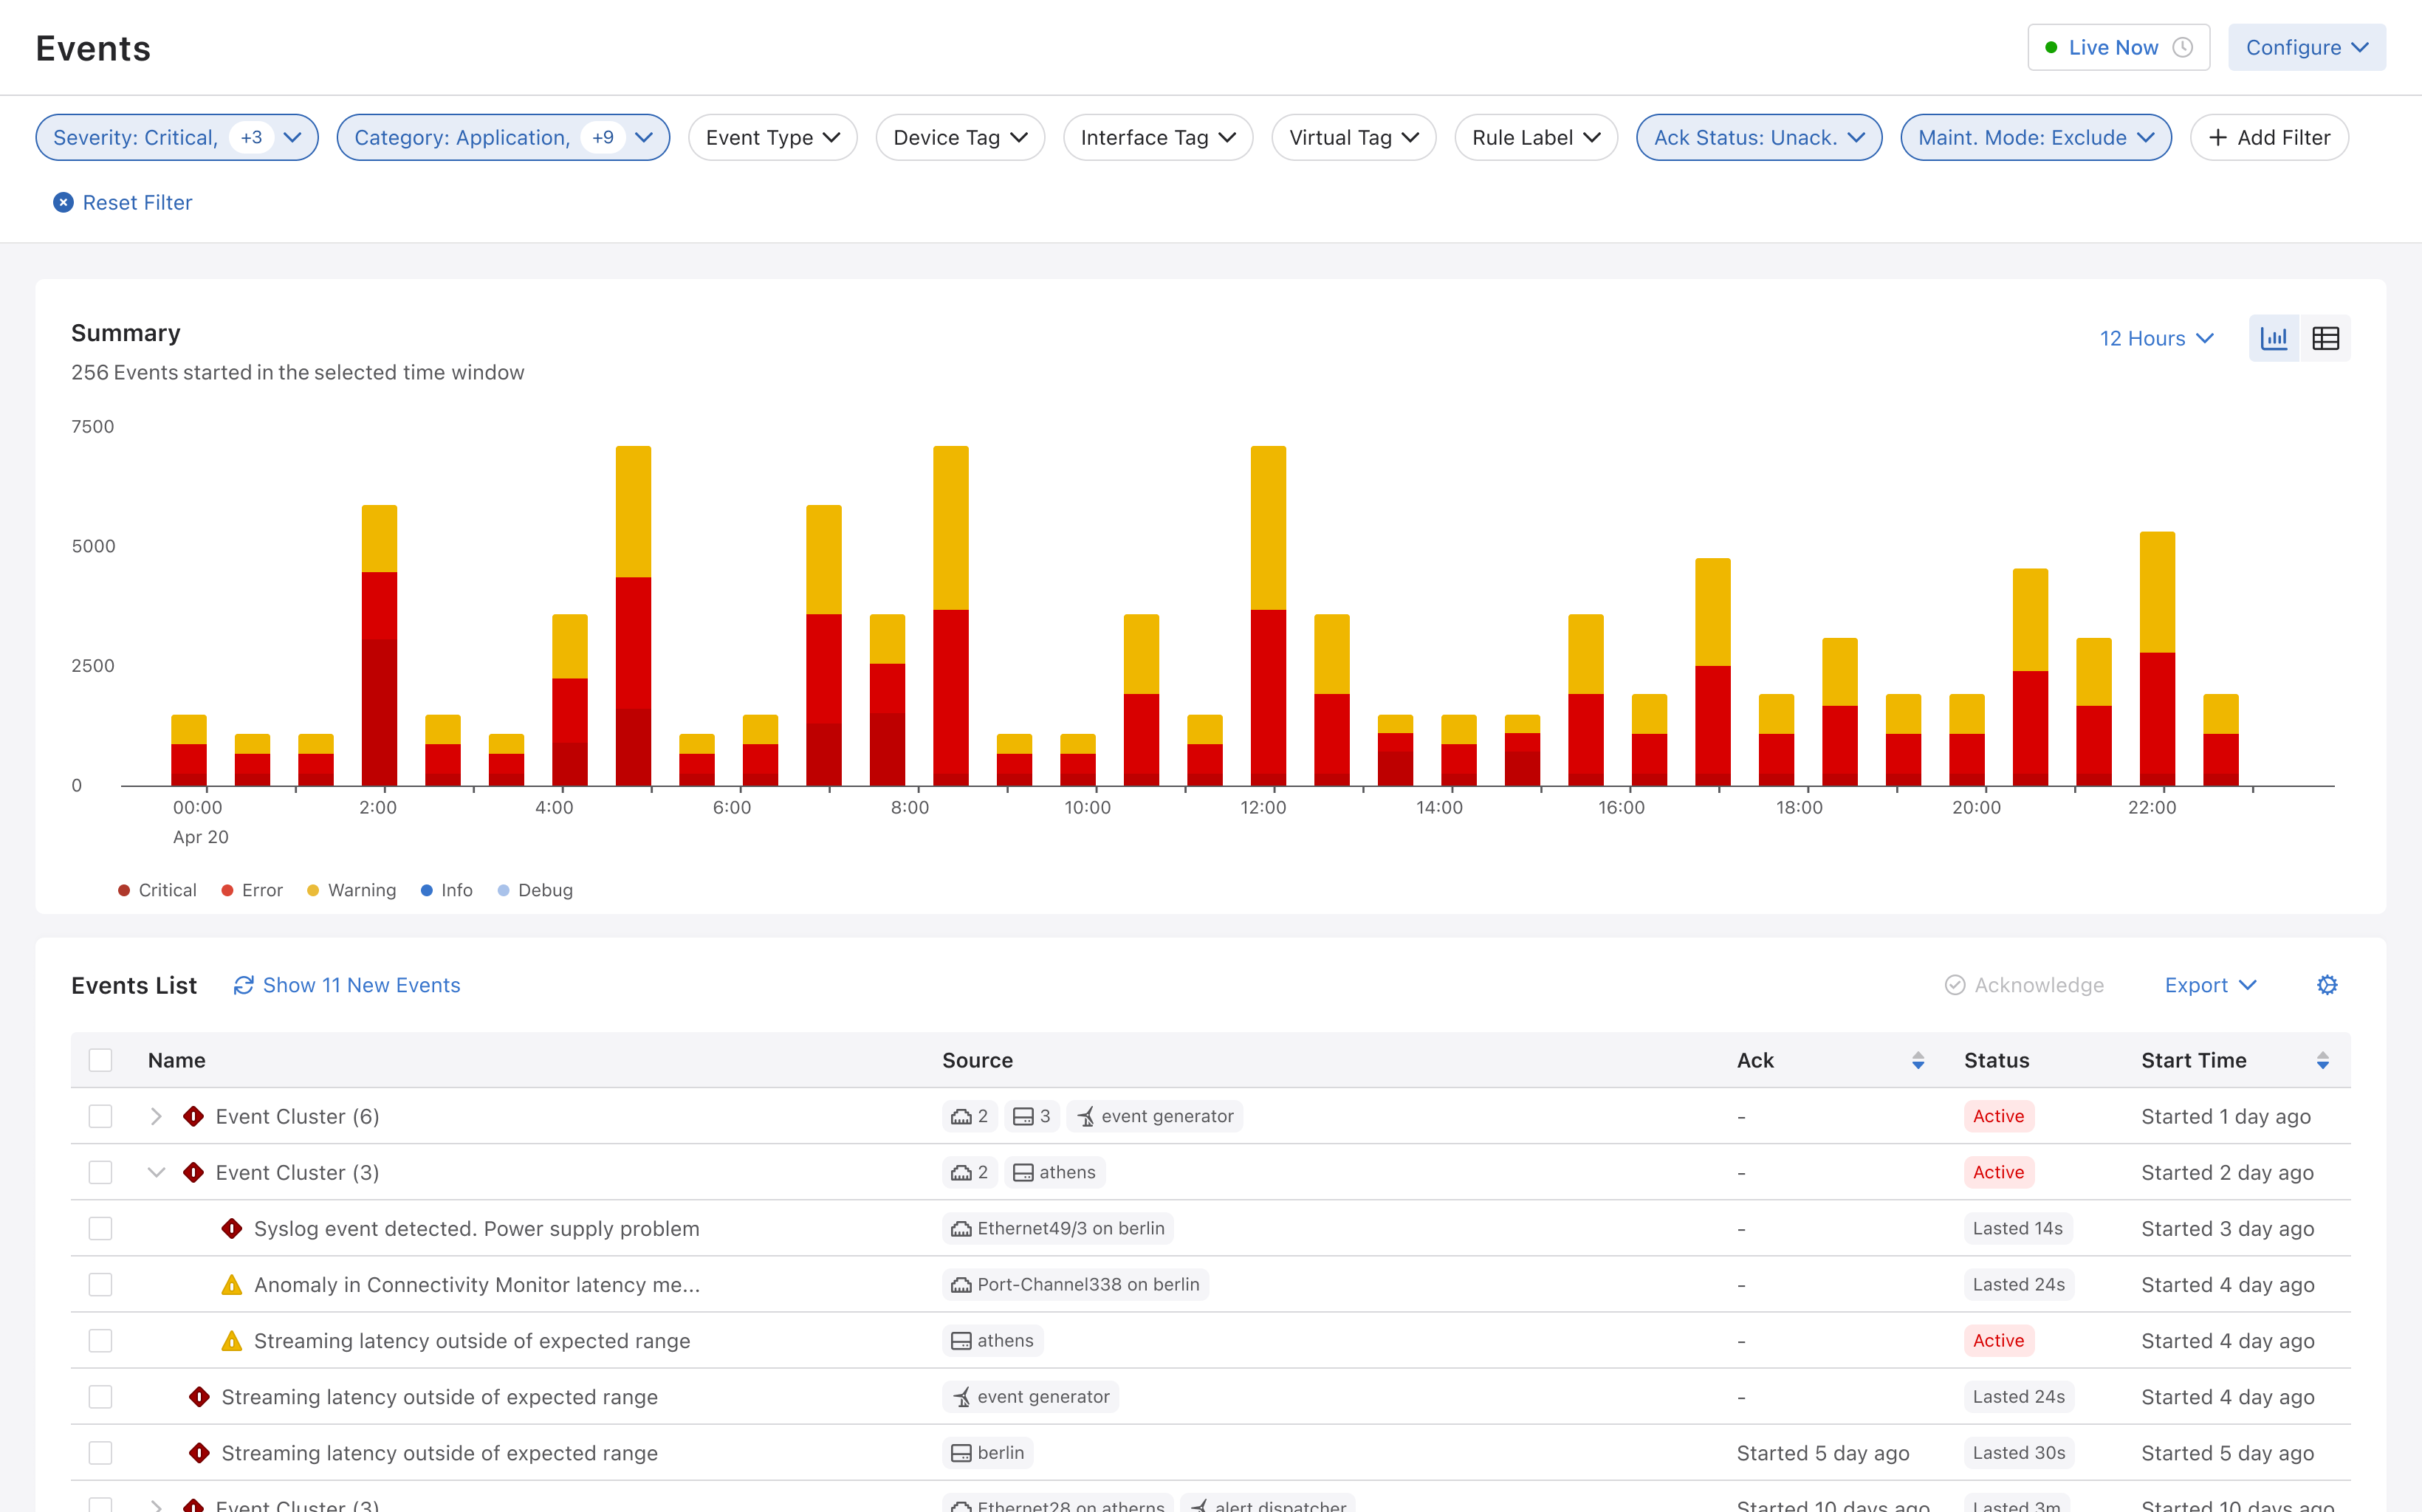
The Events Overview had a bar chart and an endless scrolling table. The bar chart's timeframe picker didn't even affect the table below it, so the two widgets were showing mismatched data. There was no health or summary view at all. Just this one table-and-filters interface.
"The Events page is great for finding a specific event, but it doesn't tell me if my network is healthy right now."
Events Overview (Before)
02 · Final Design
Designing a more cohesive dashboard.
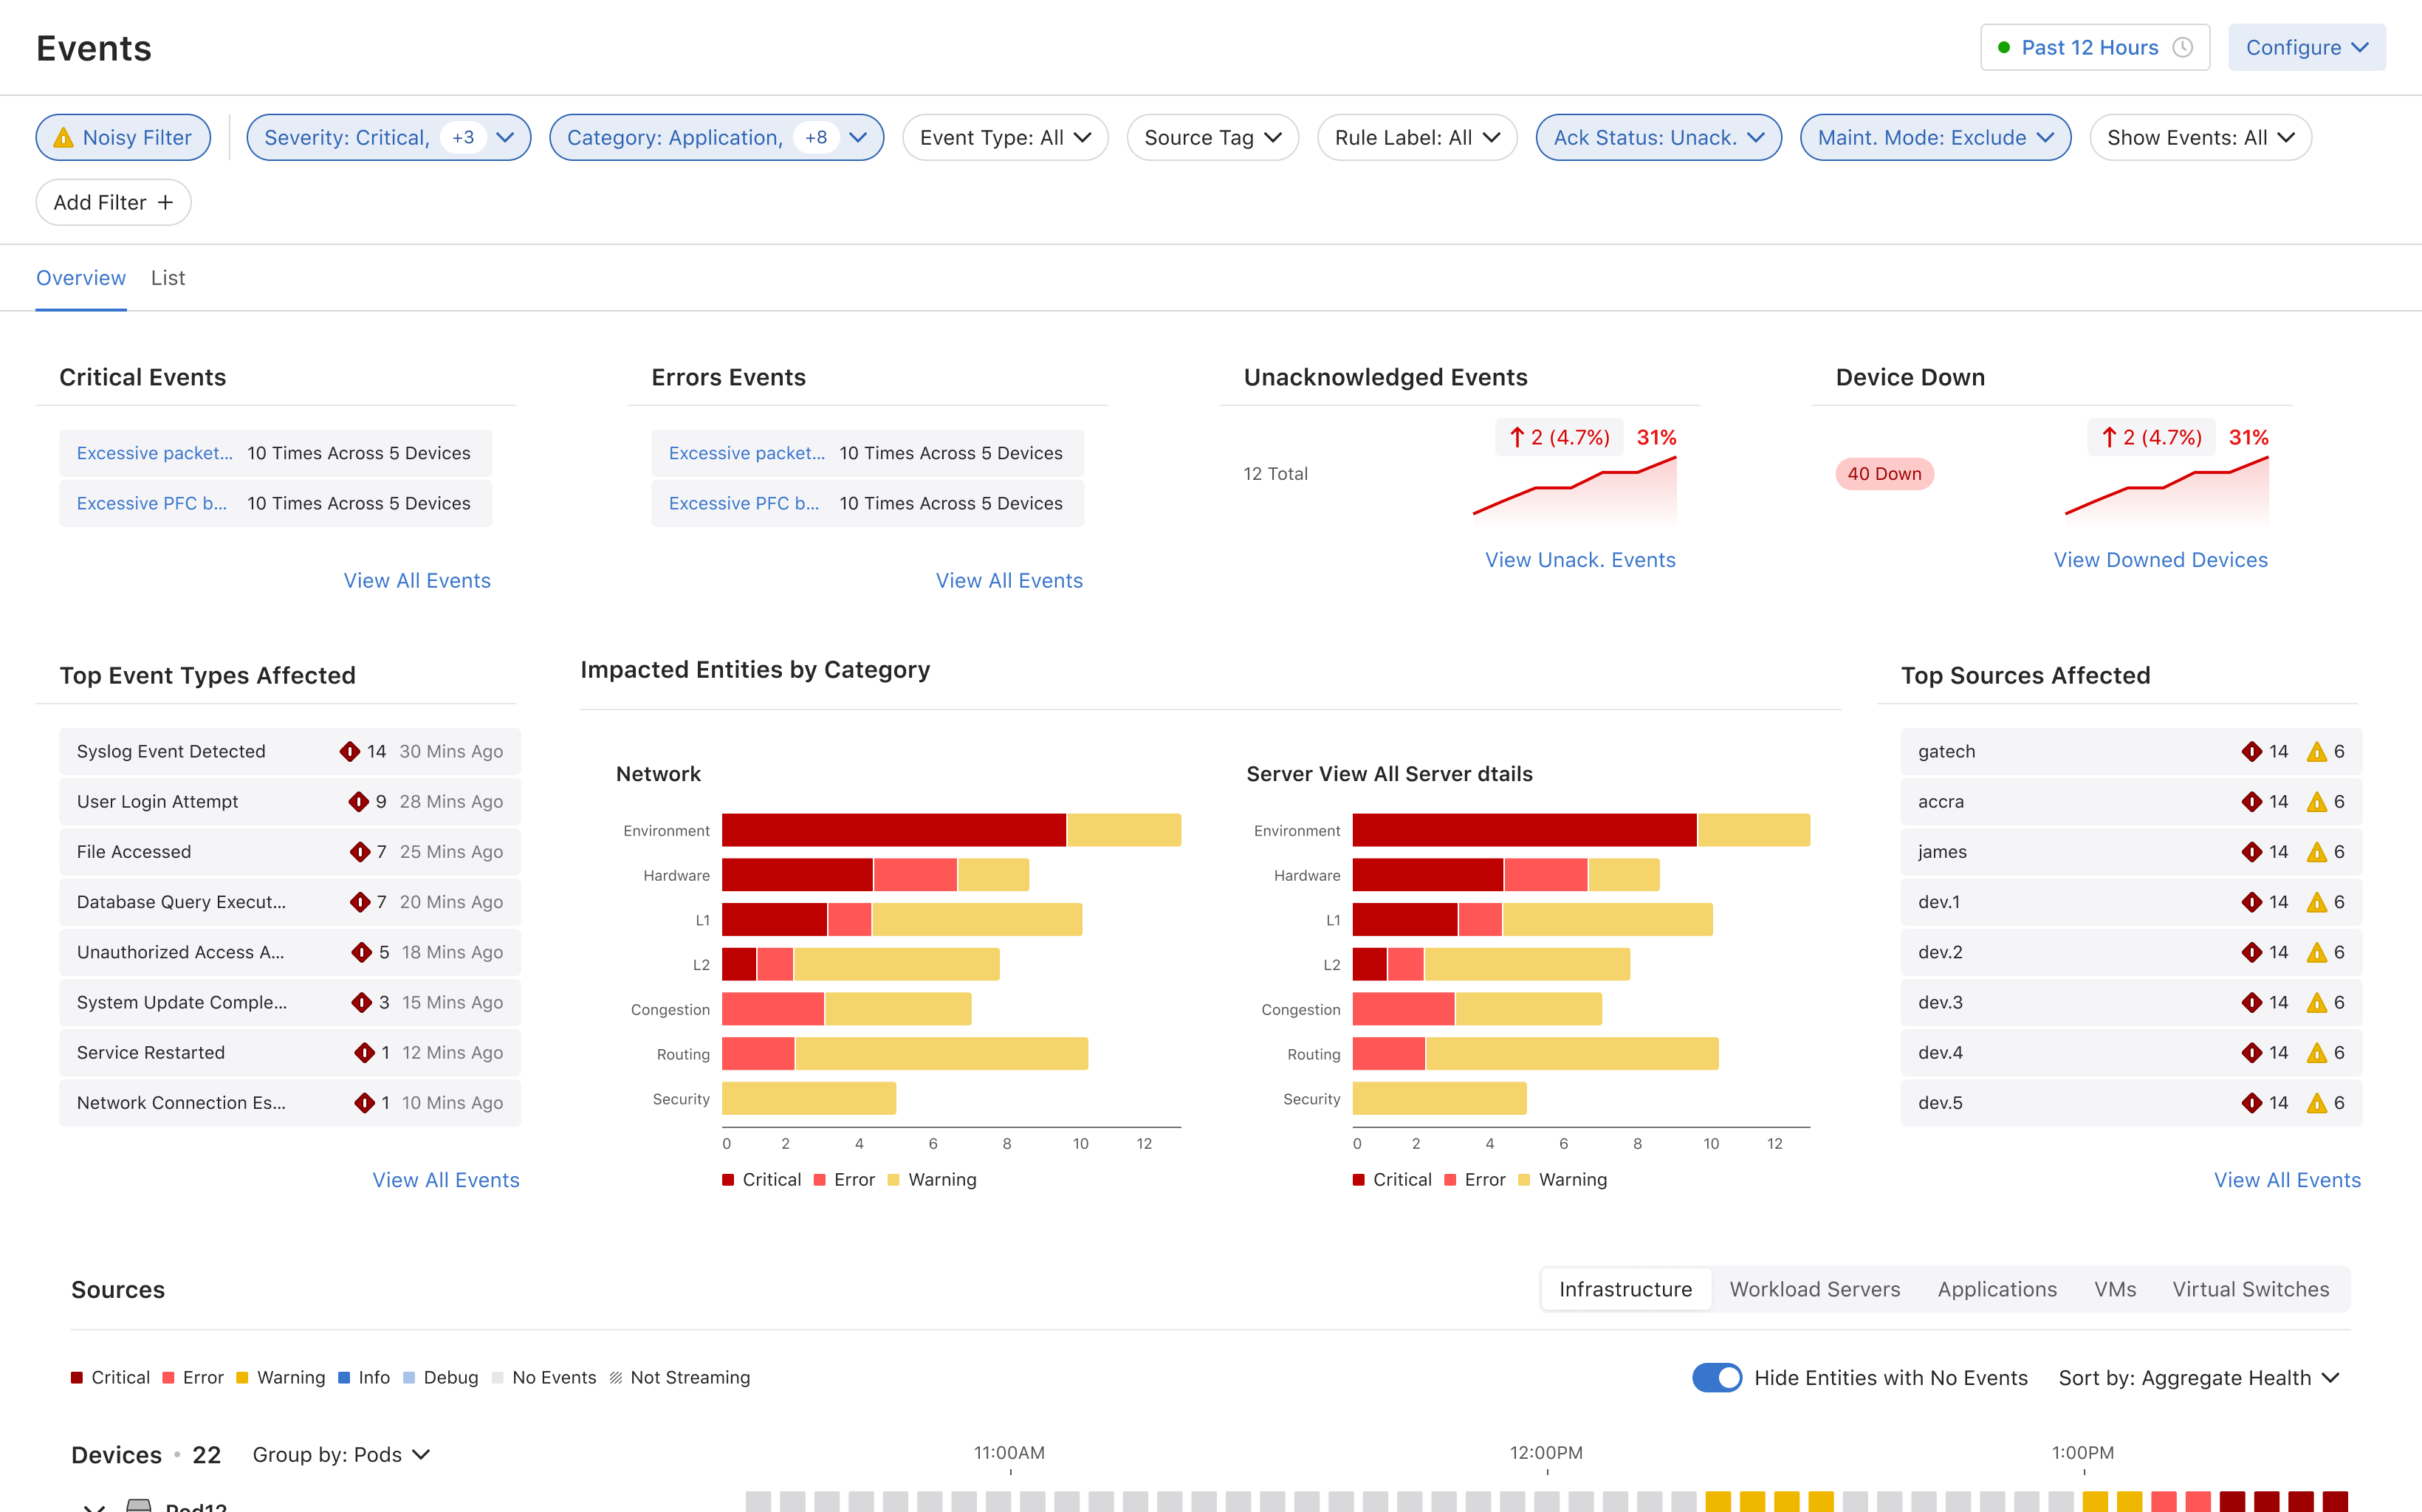
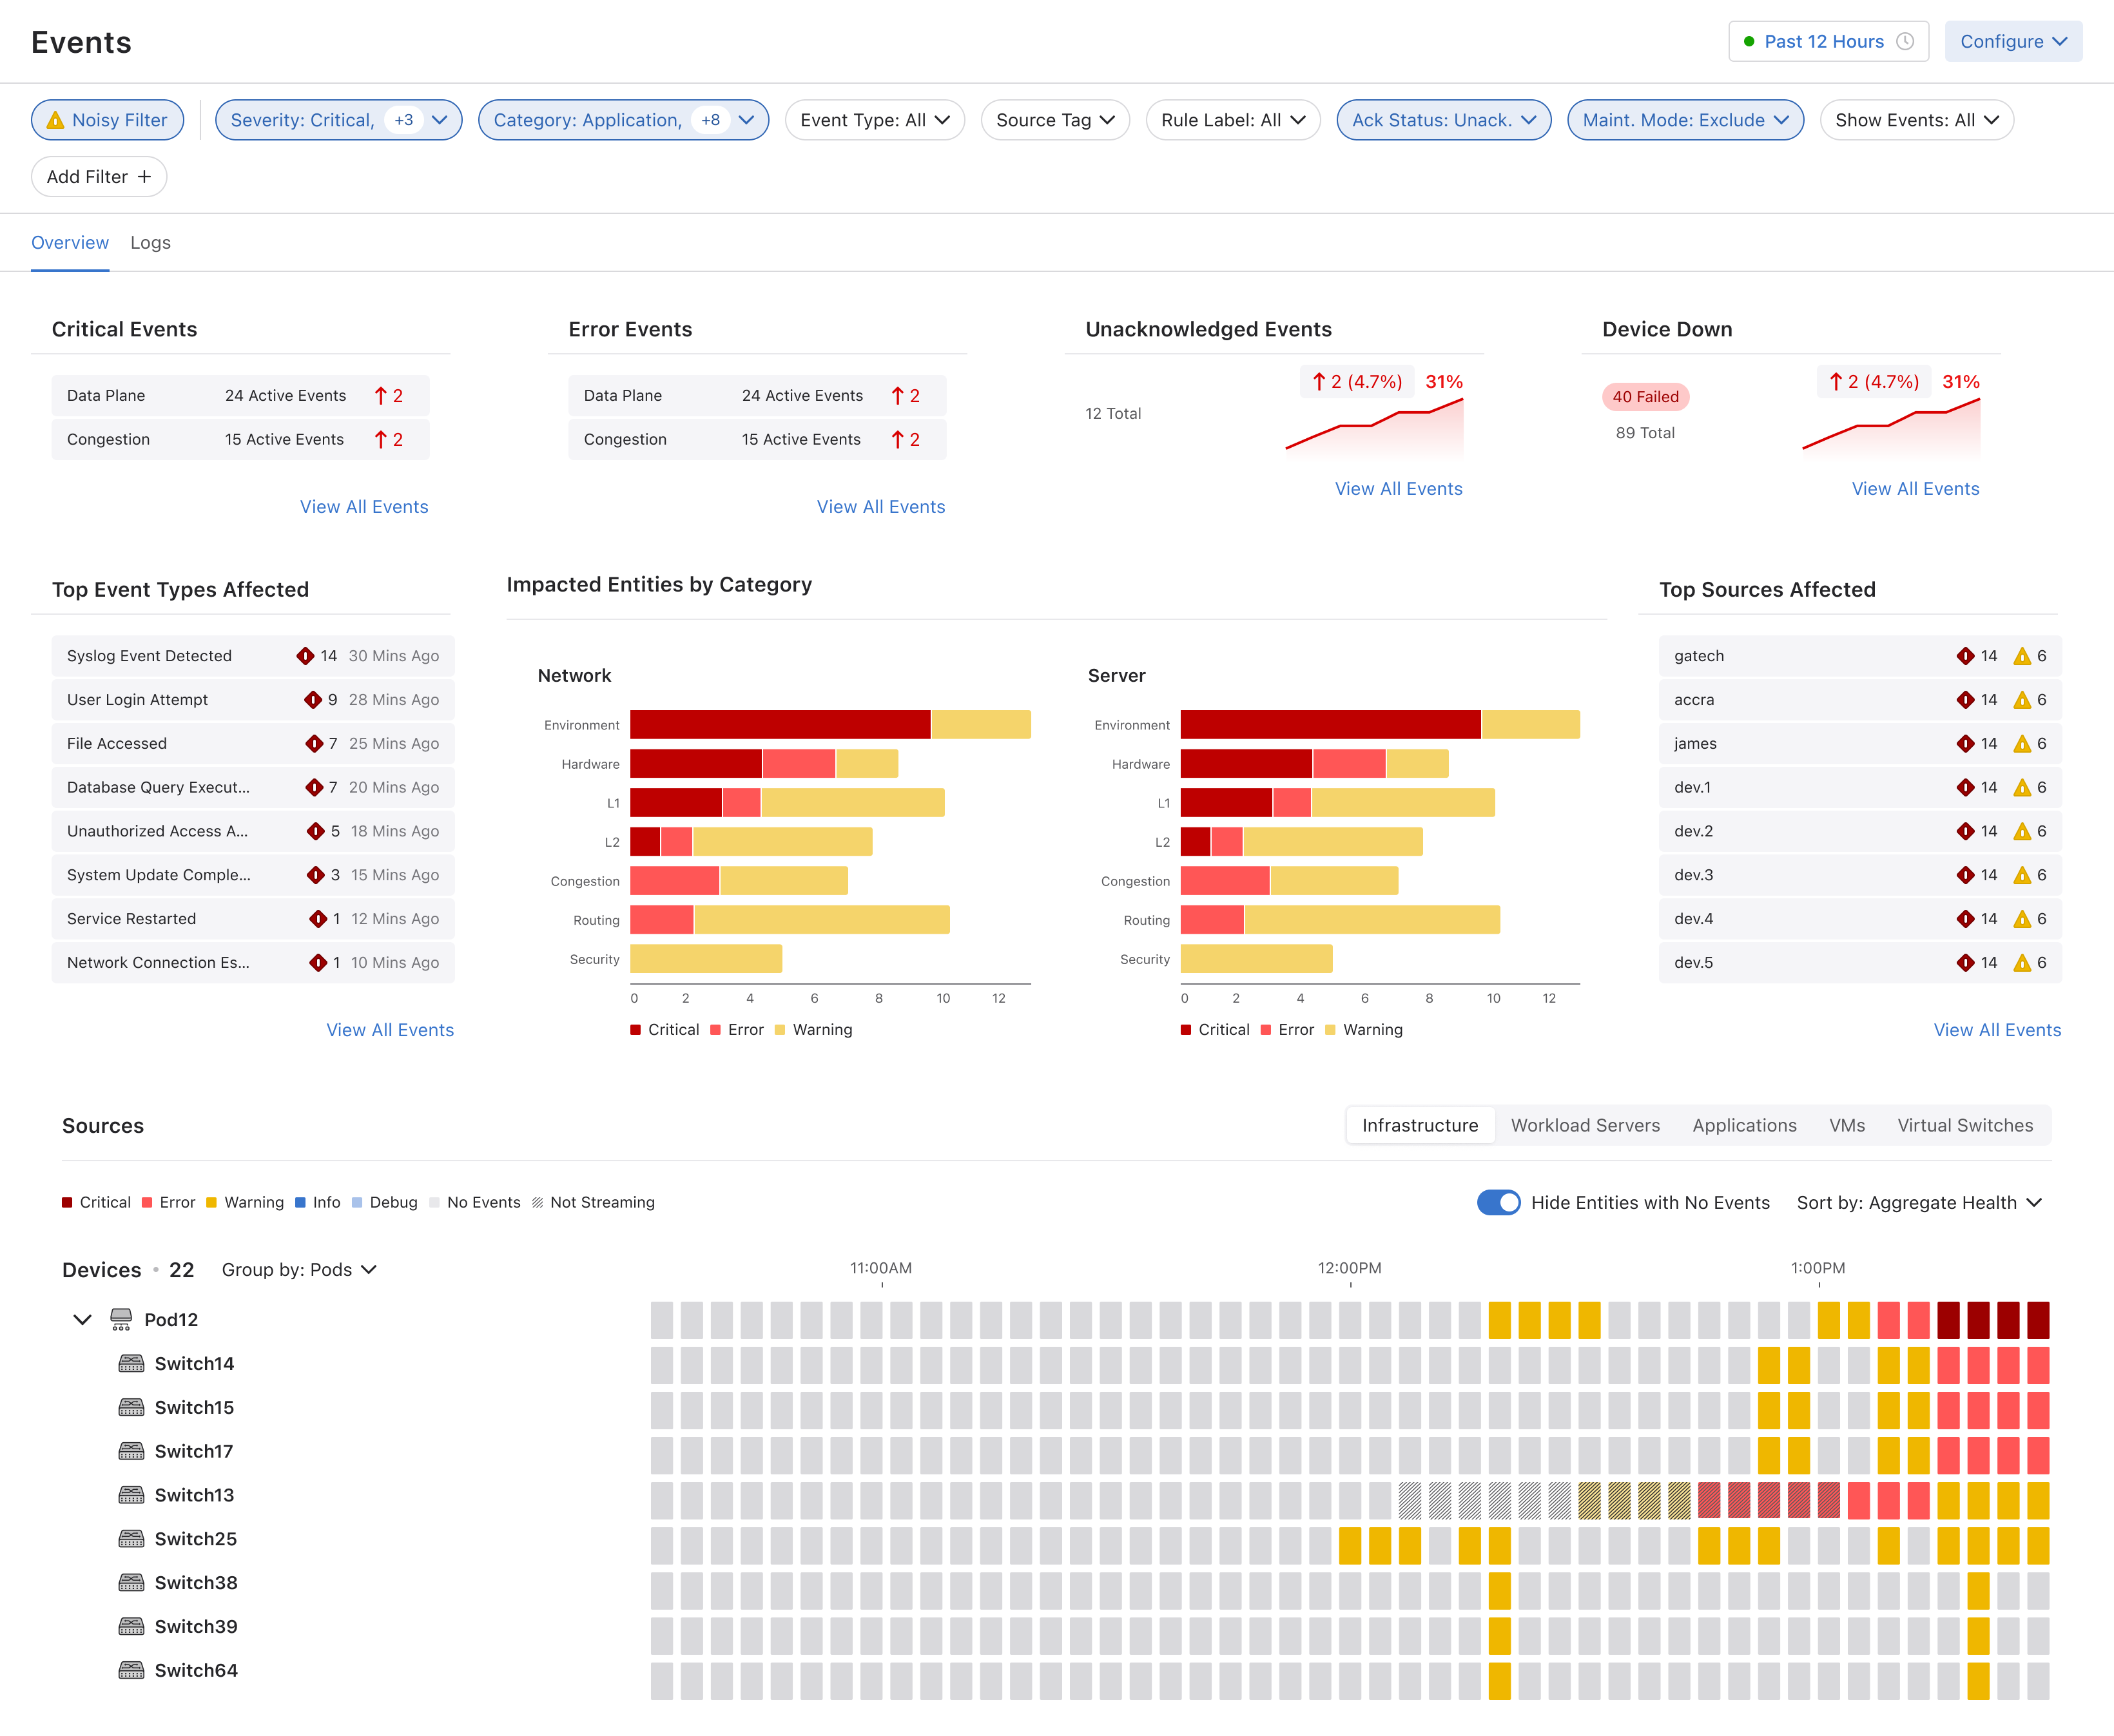
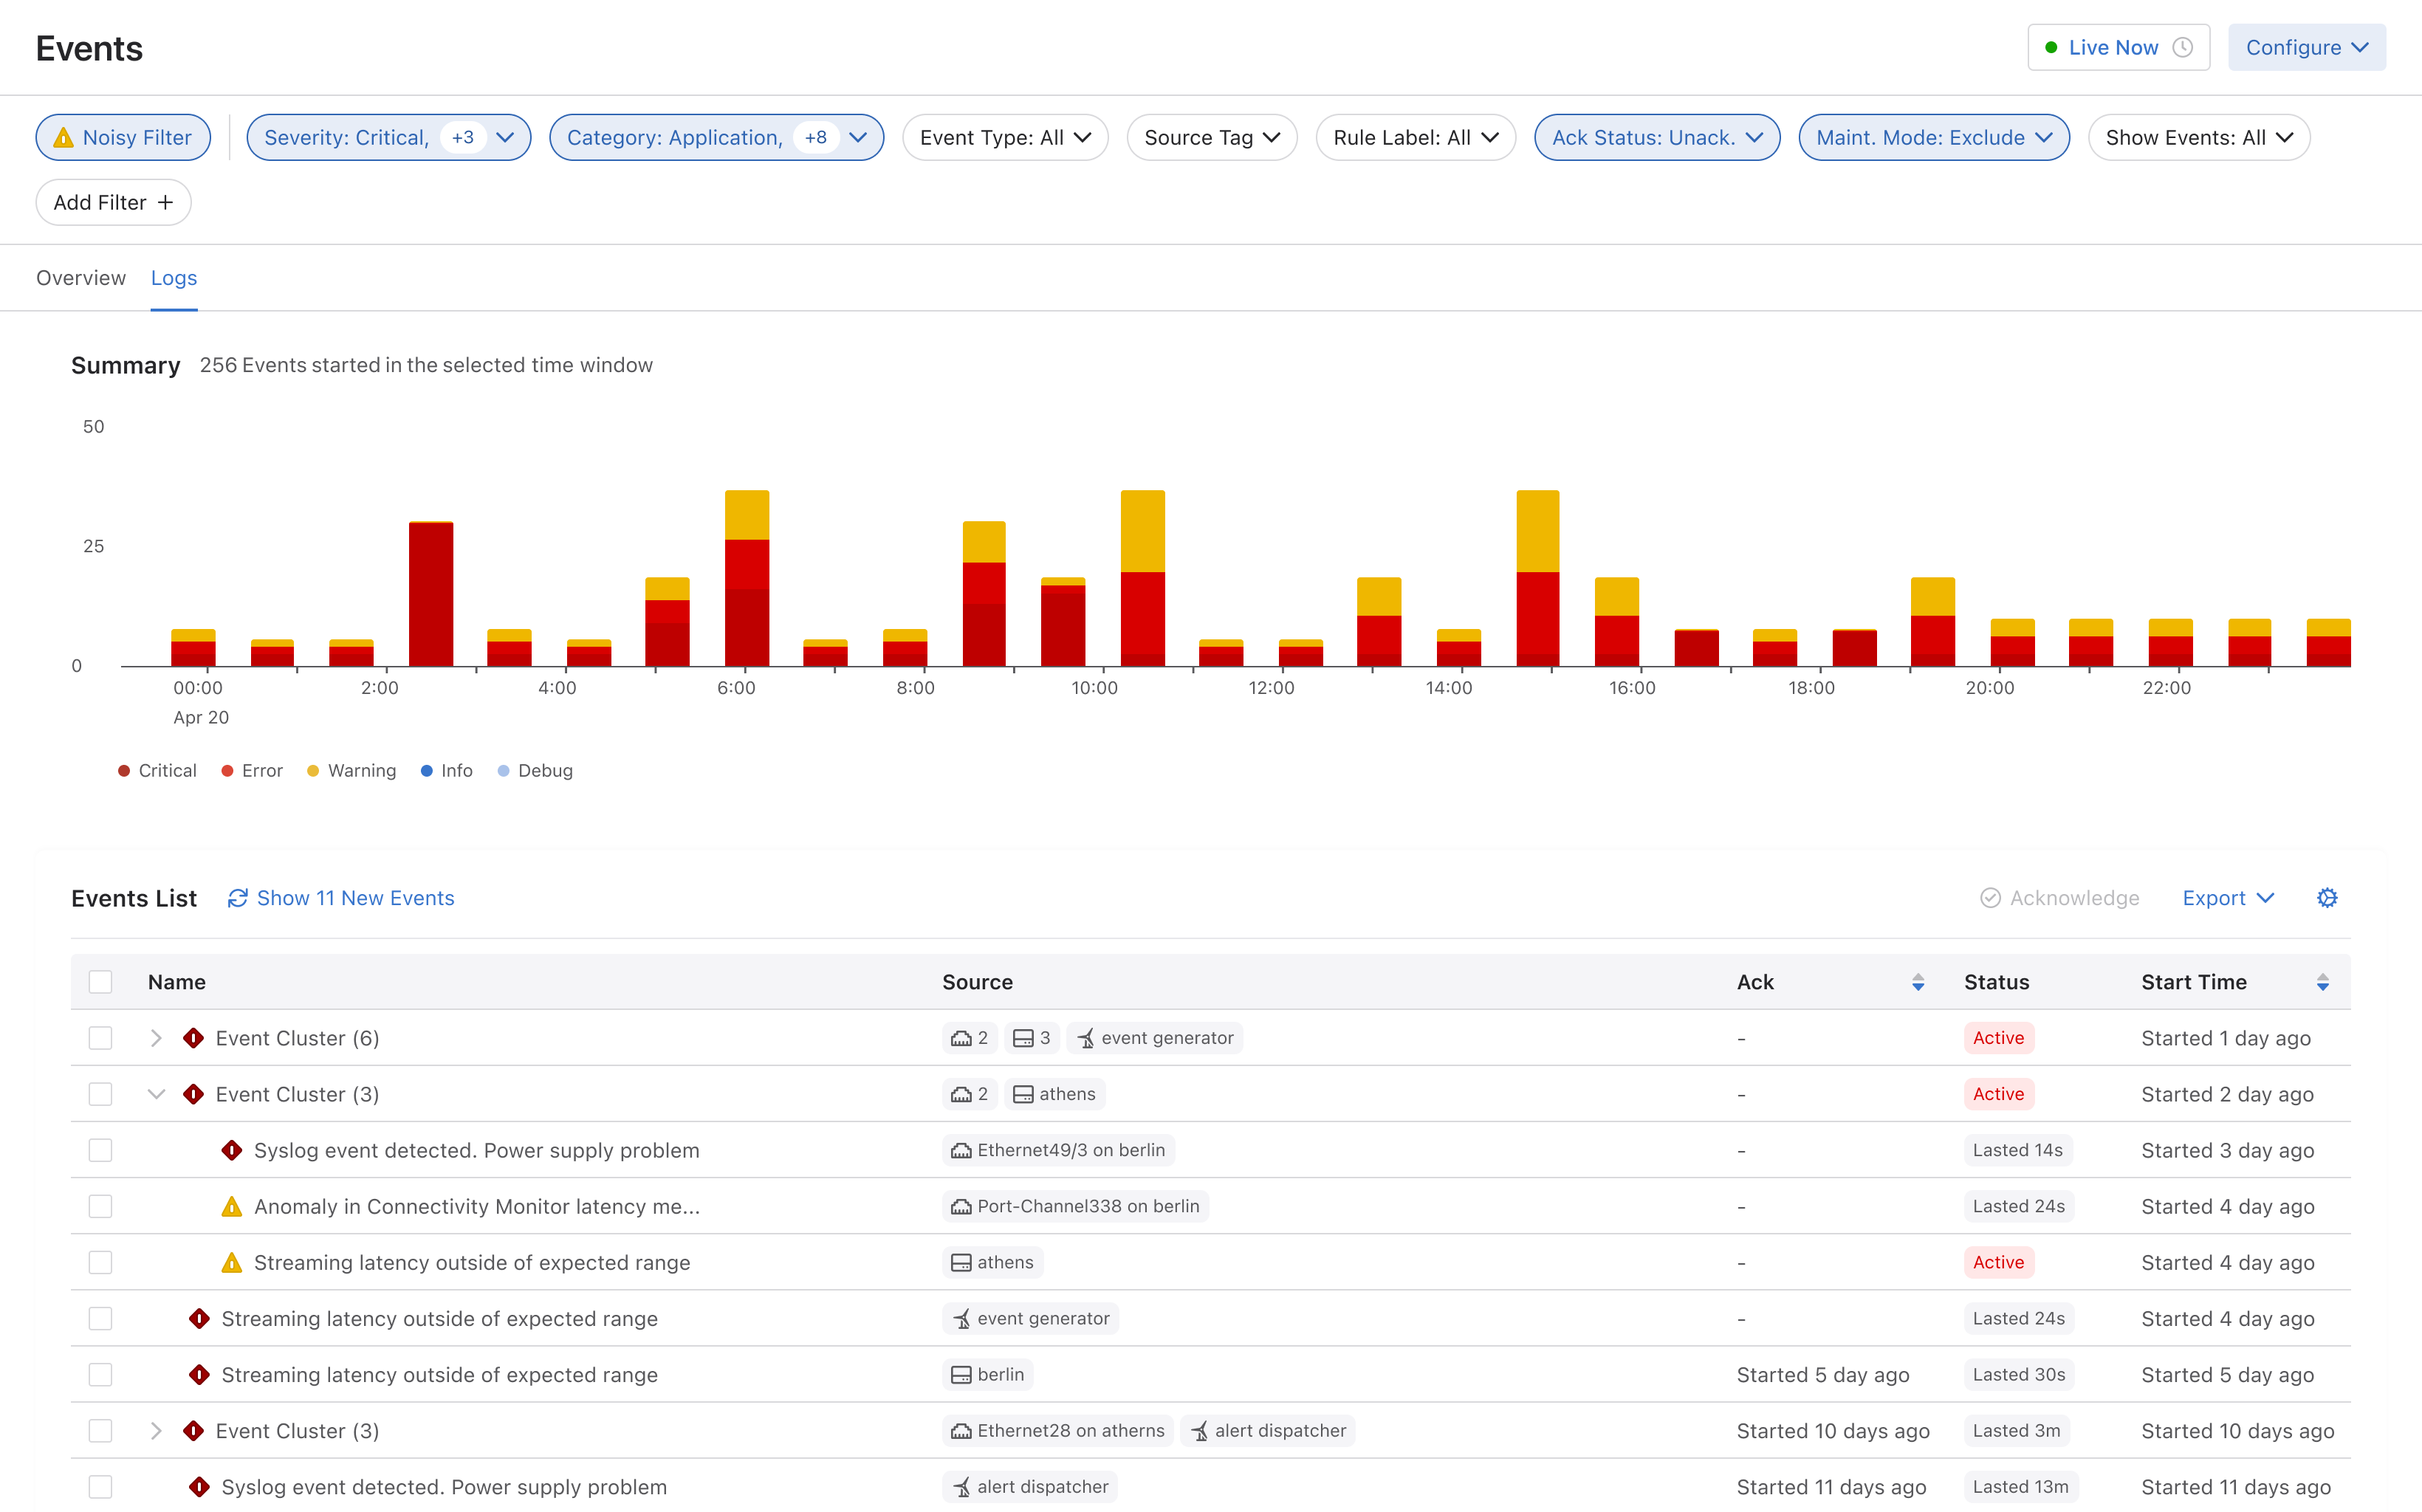
After proper design research and user testing, I created a cohesive redesign of the events landing page.
Phase 2 Dashboard — Landing Page
Phase 2 Dashboard — Table View
03 · Research
Understanding the current user flow.
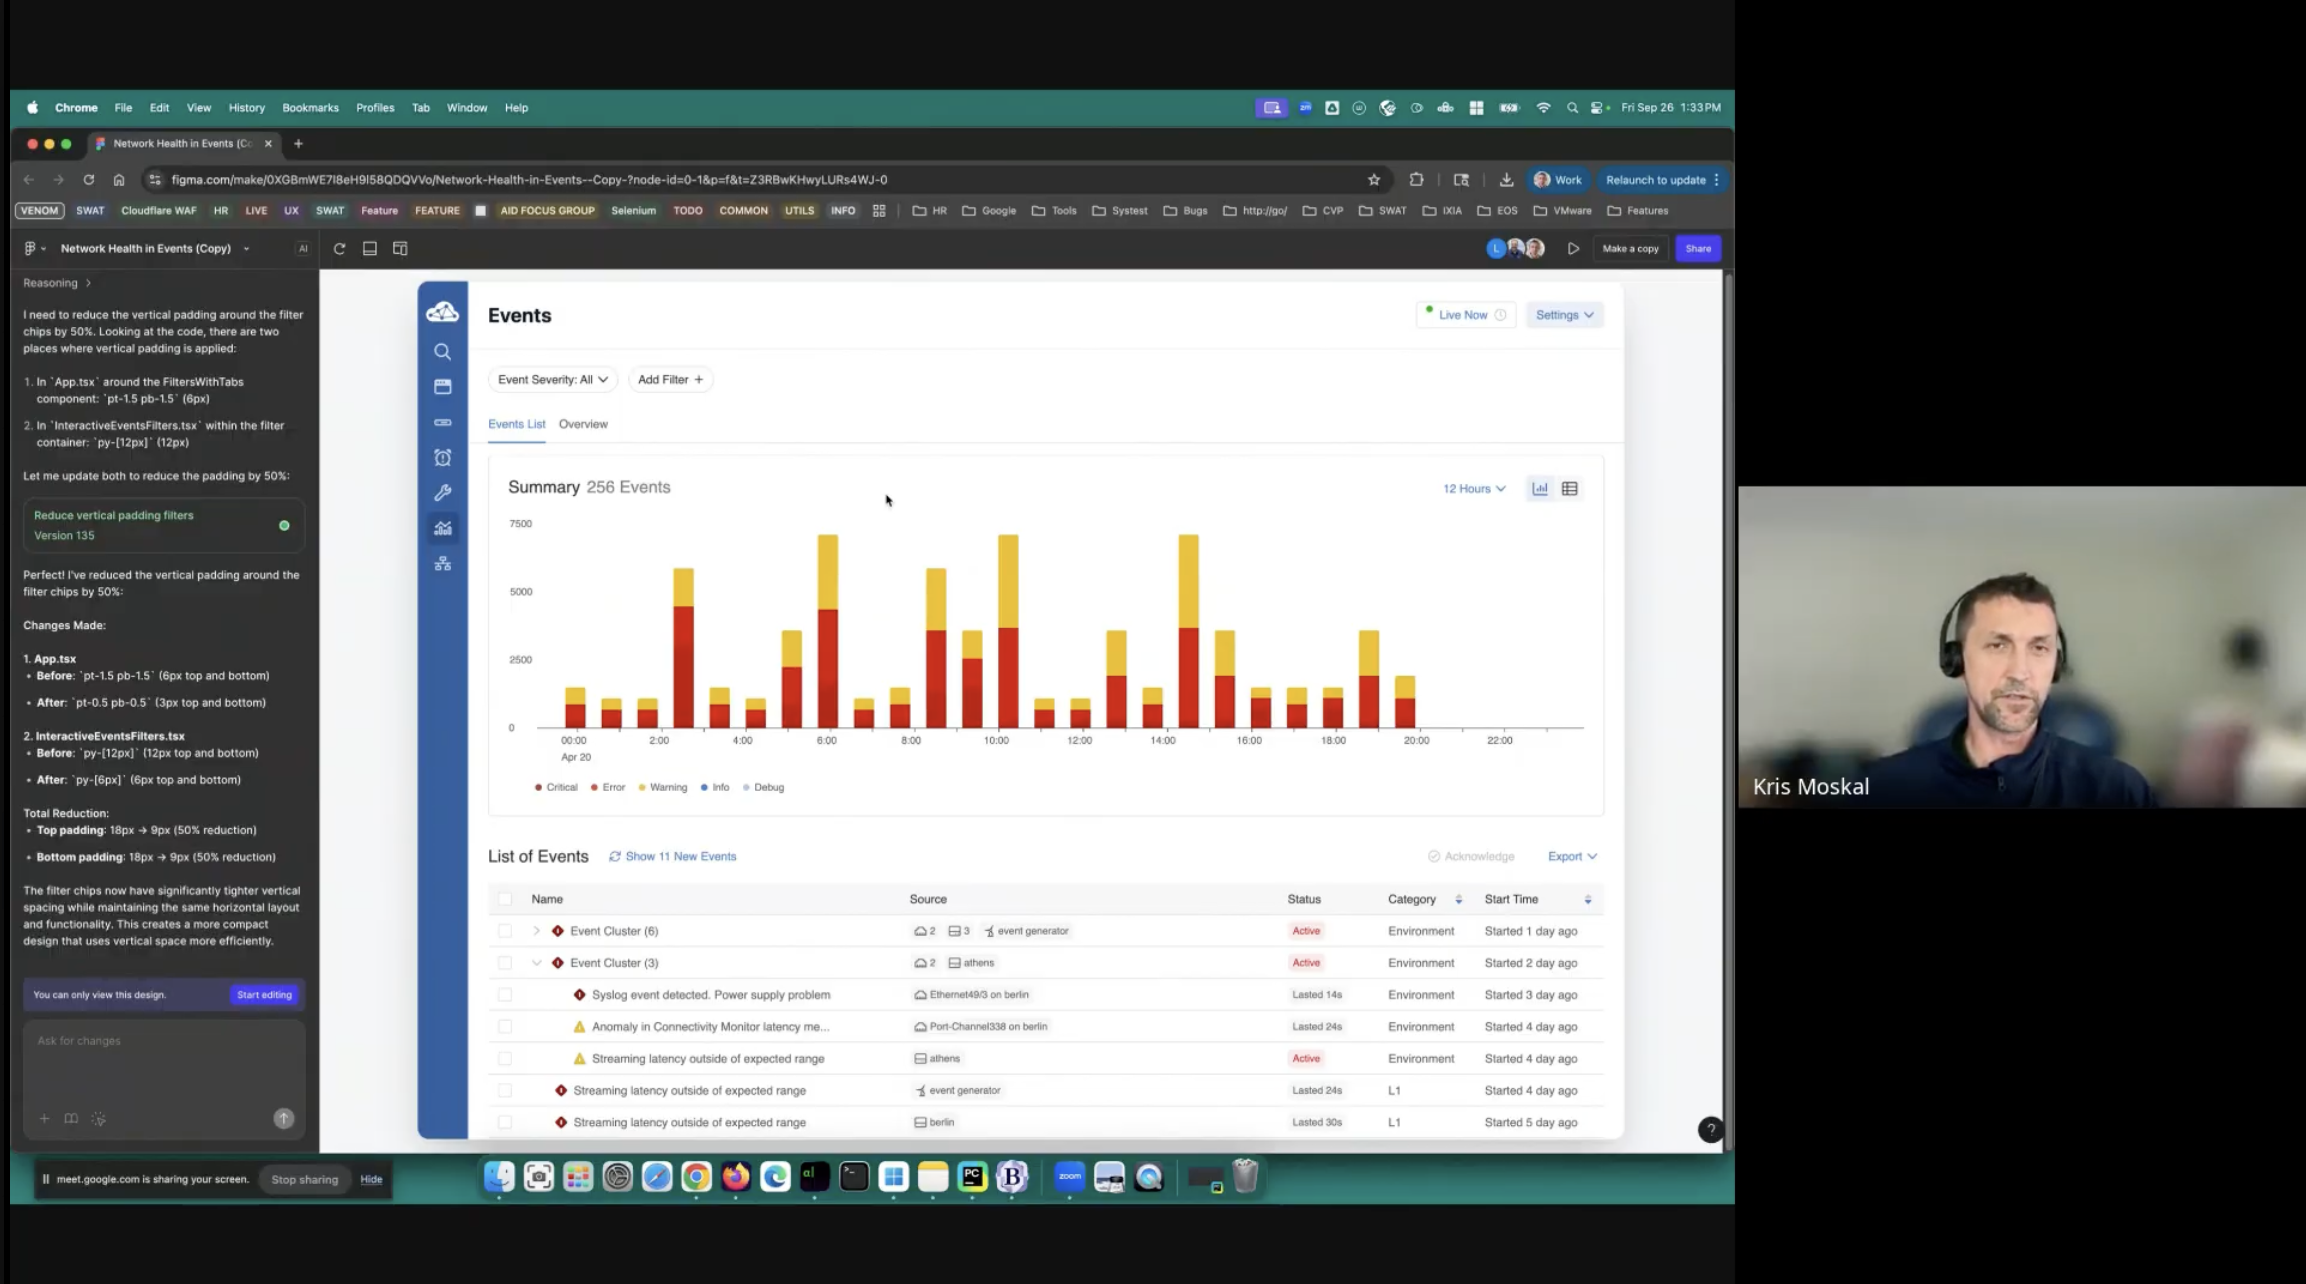
I sat down with the support team and engineering team to understand how operators use the page. There were two main user flows:
- Daily check-in, continuous monitoring to keep the network organized.
- Notification from a coworker or connected platform (integrations with Slack, email, and other third-party programs) alerting them to begin troubleshooting.
SE, Engineer & Sales Interviews
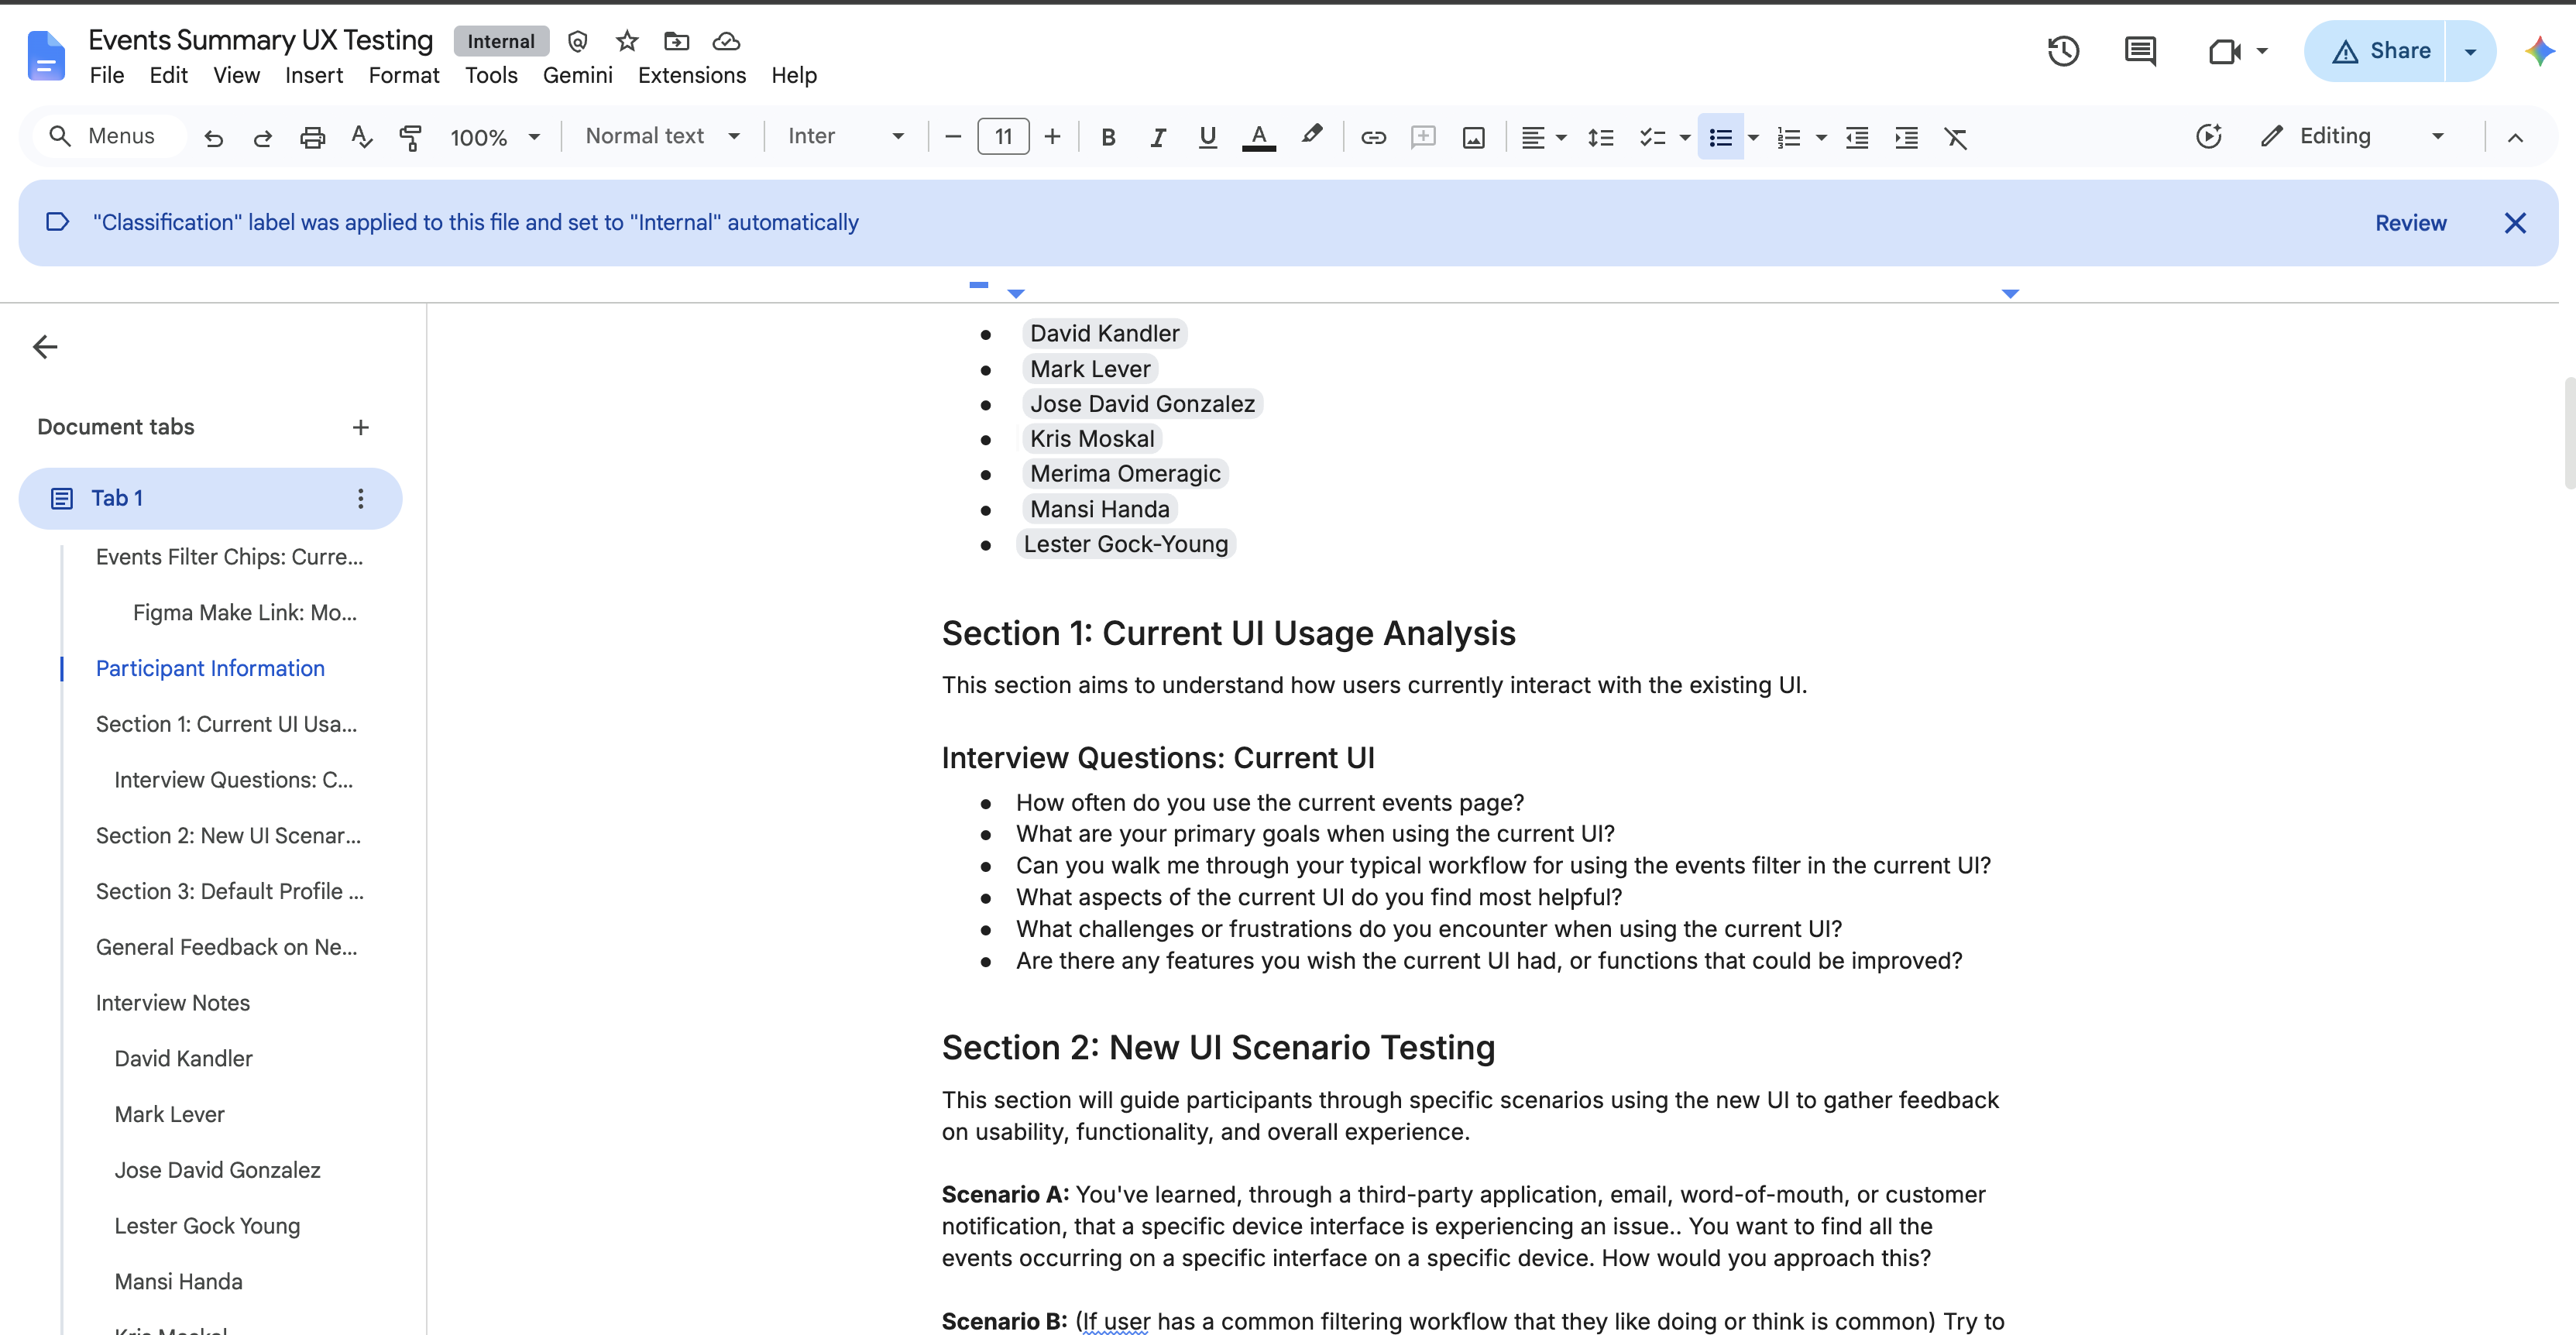
Live Interview Session
What the research told us.
-
Finding 01
Unnecessary noise
Because of how events are configured, CloudVision produces thousands of events. Most of them aren't important on a day-to-day basis.
-
Finding 02
The table only serves one side
The existing filter-heavy table works well once you already know roughly what you're looking for. It does nothing for the operator who's just checking in.
-
Finding 03
Network health at a glance
With so many events firing, operators struggle to figure out which ones need attention now and which can wait.
Who we designed for.
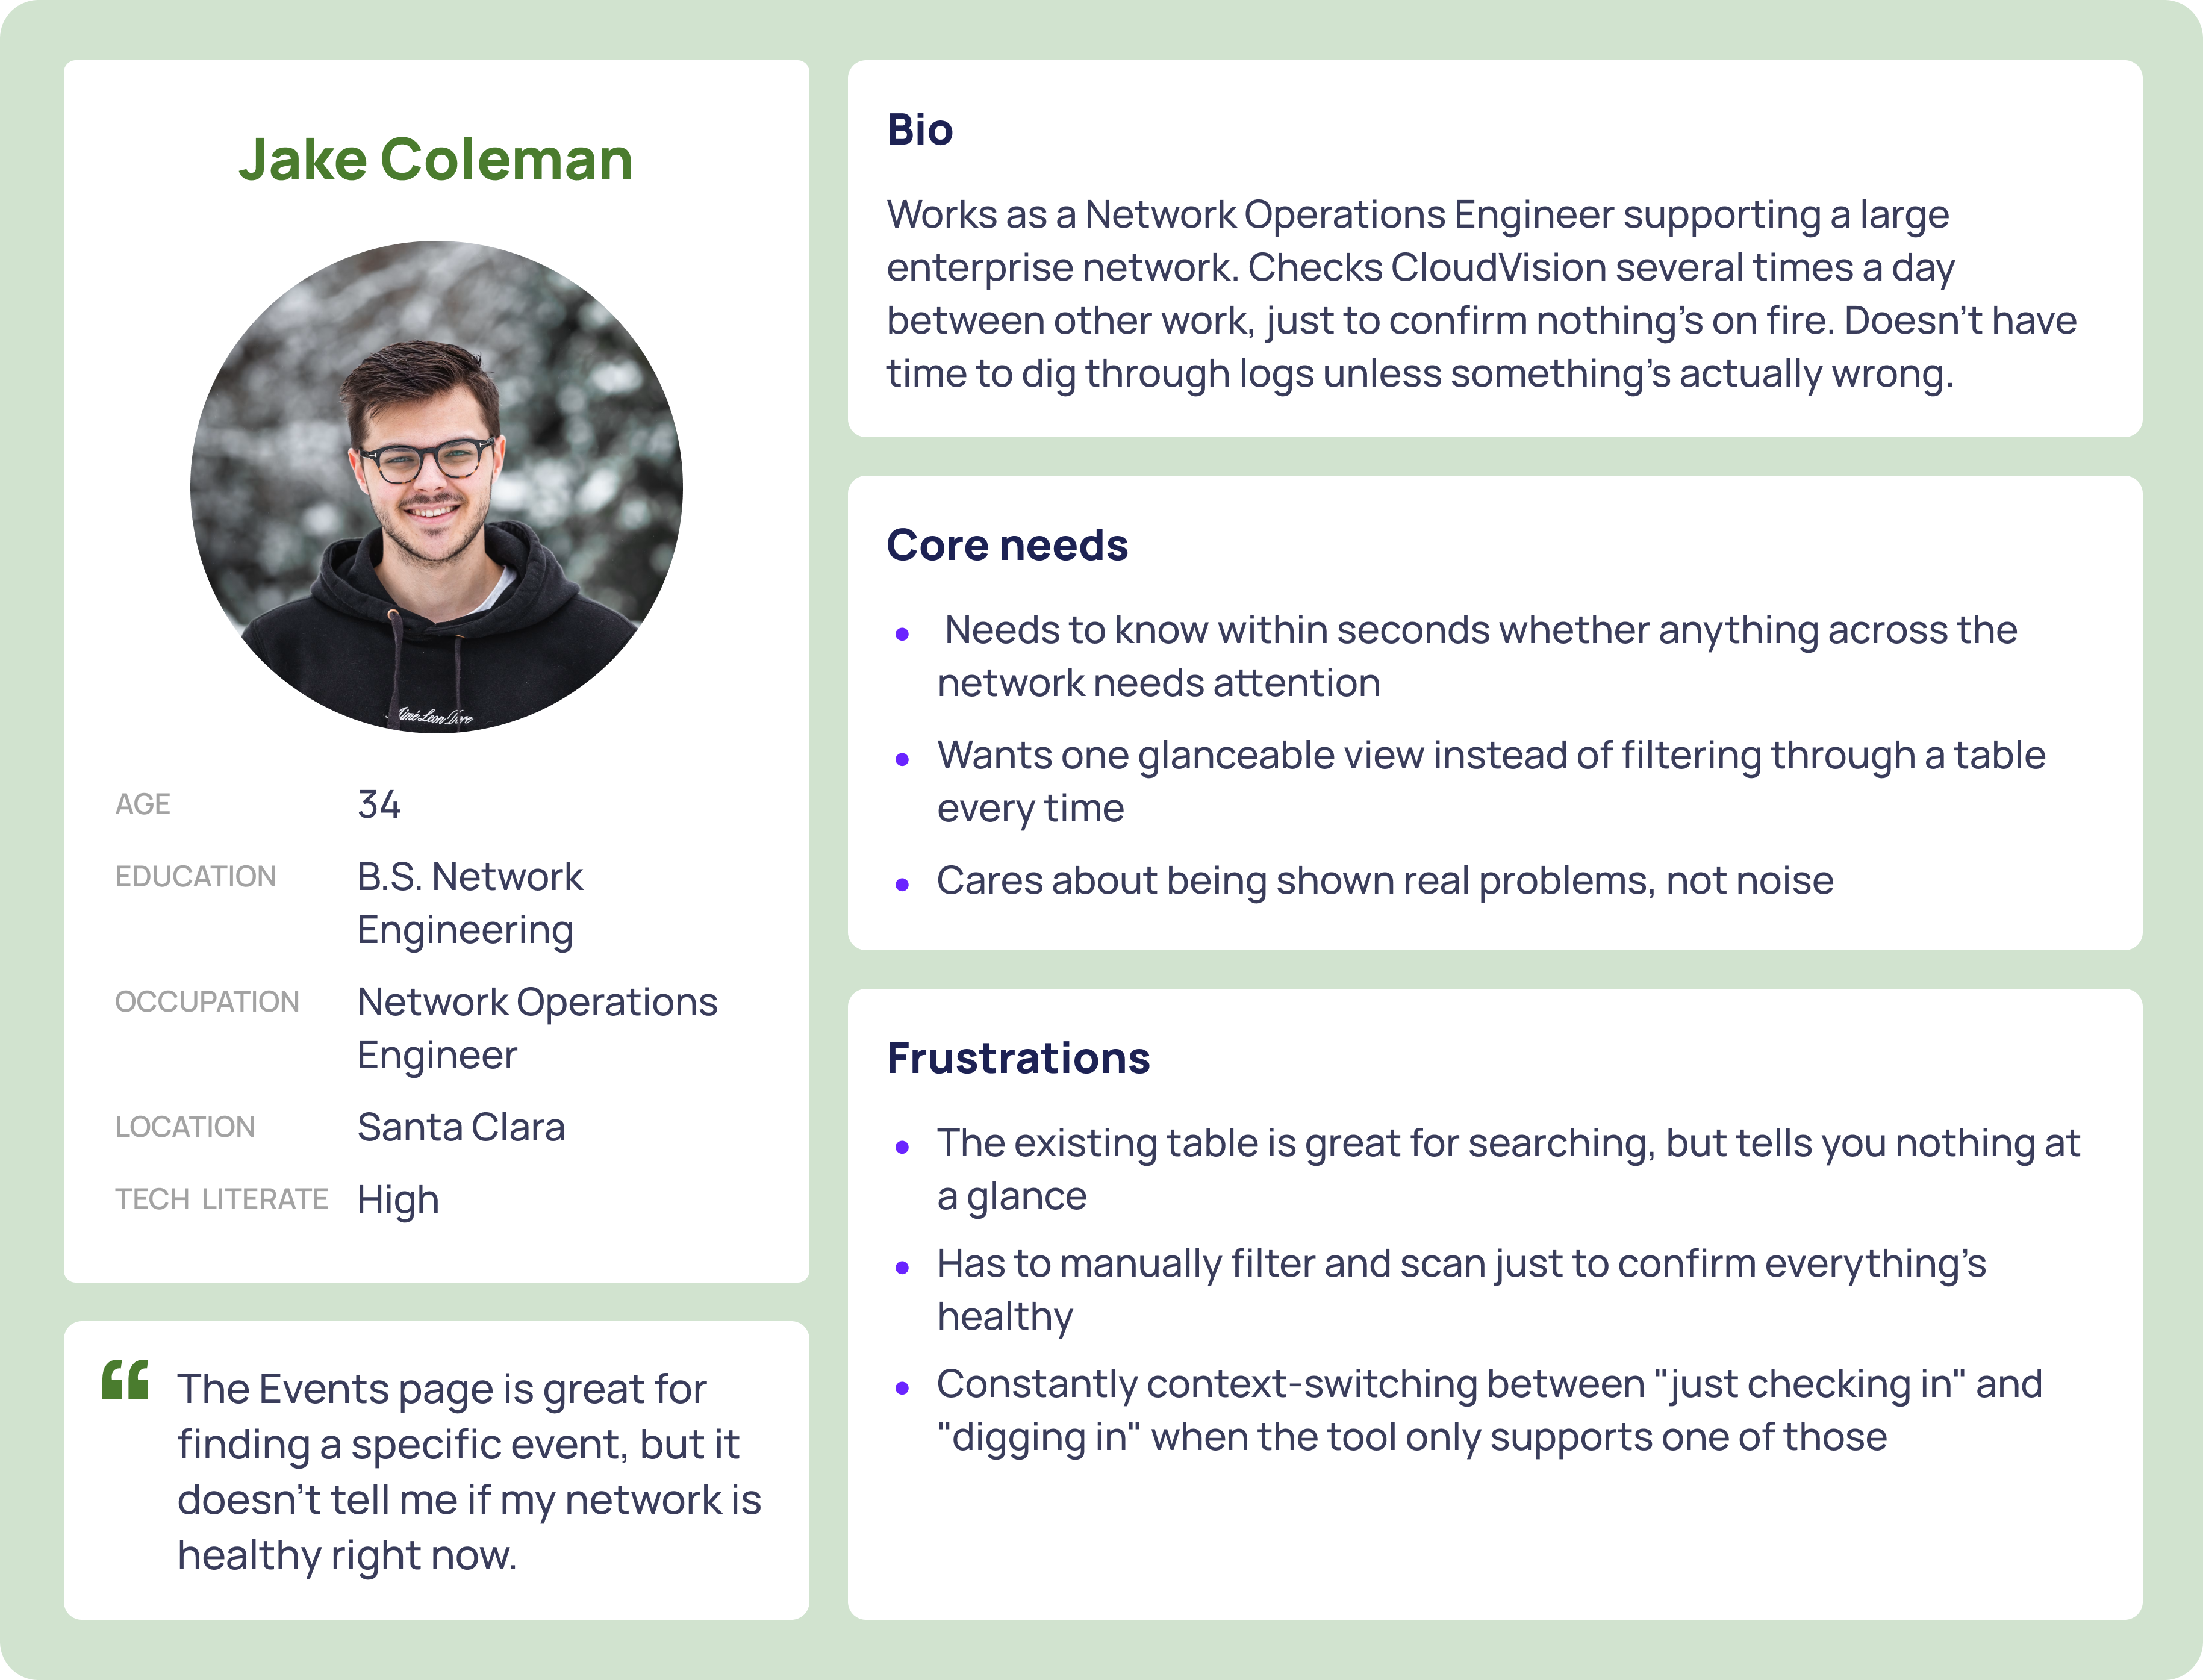
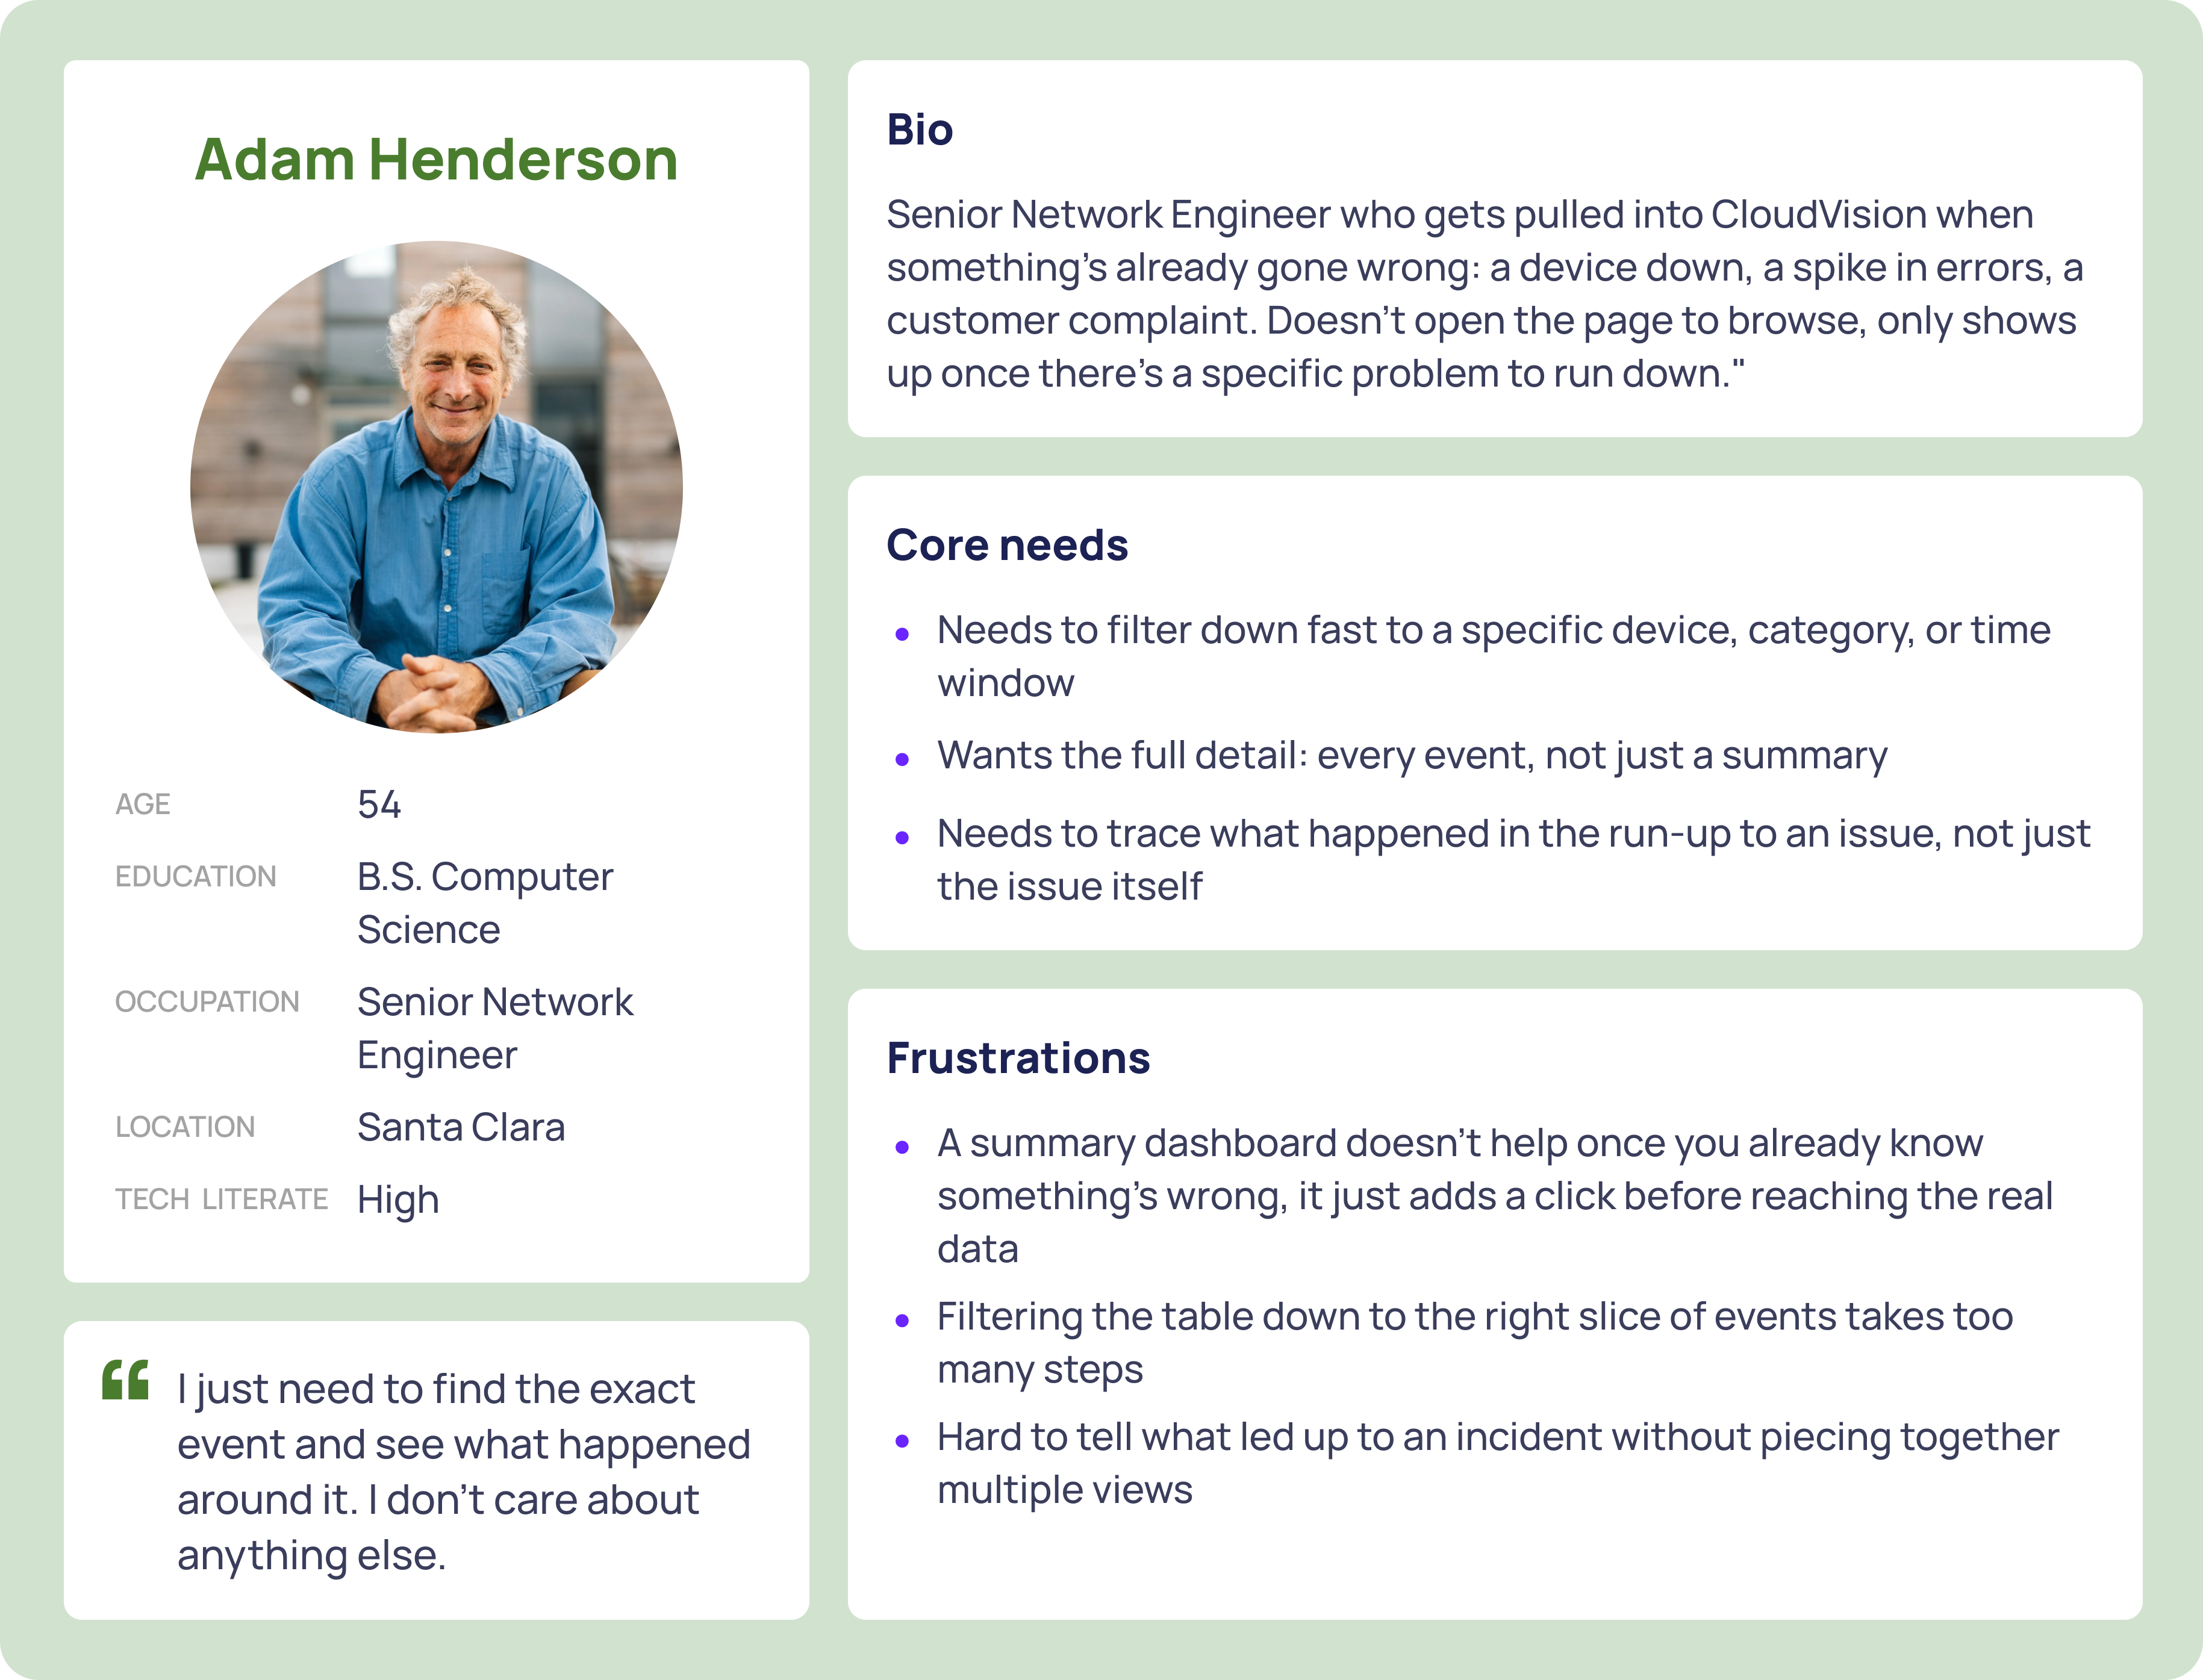
Everyone has different priorities.
Within each workflow, operators had their own mental model for what mattered most.
Some operators come in with a specific device or alert already in mind, and want to filter down to it fast.
Operators responsible for one area, like hardware or security, want the dashboard filtered to just that by default.
Some care less about individual events and more about which device is generating the most activity right now.
Others don't trust a single number and want to see if it's a one-off spike or part of a pattern.
Some only care about their part of the network. What's happening elsewhere isn't their problem.
"We get hundreds of environment alerts a day, but only a handful actually need someone to look at them. The rest are just fans spinning up."
04 · A/B Testing
Testing information hierarchy and existing workflows.
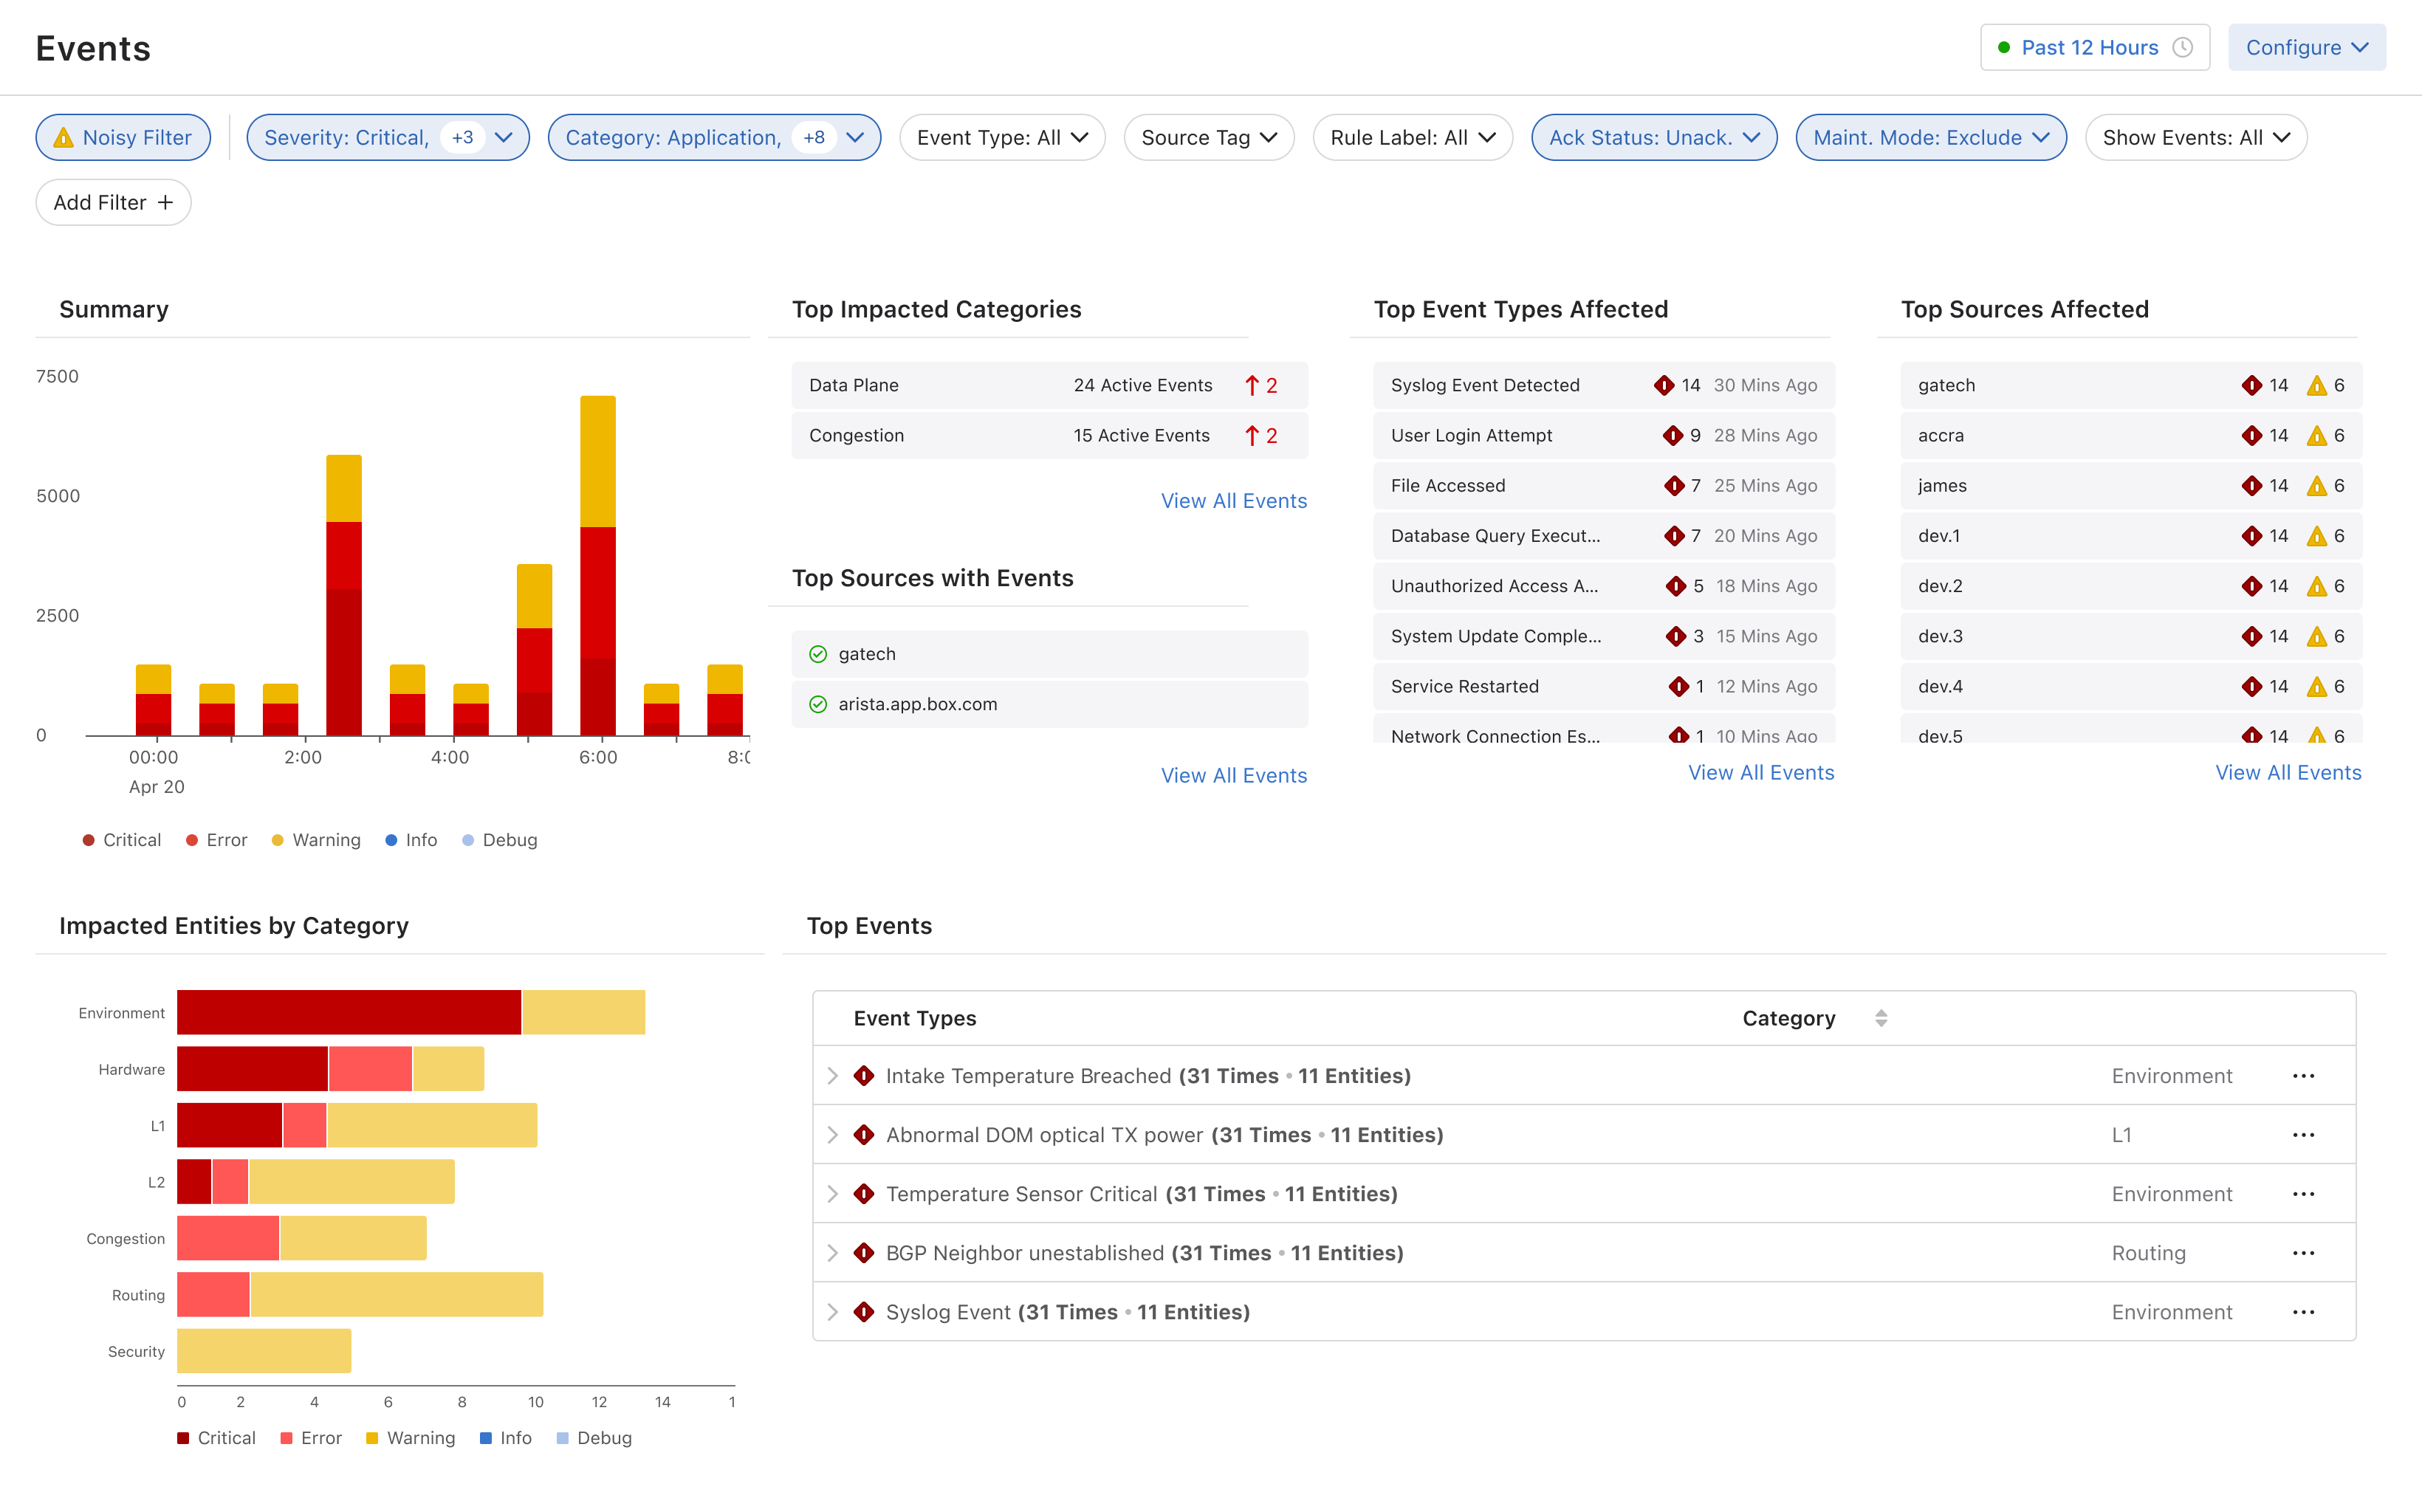
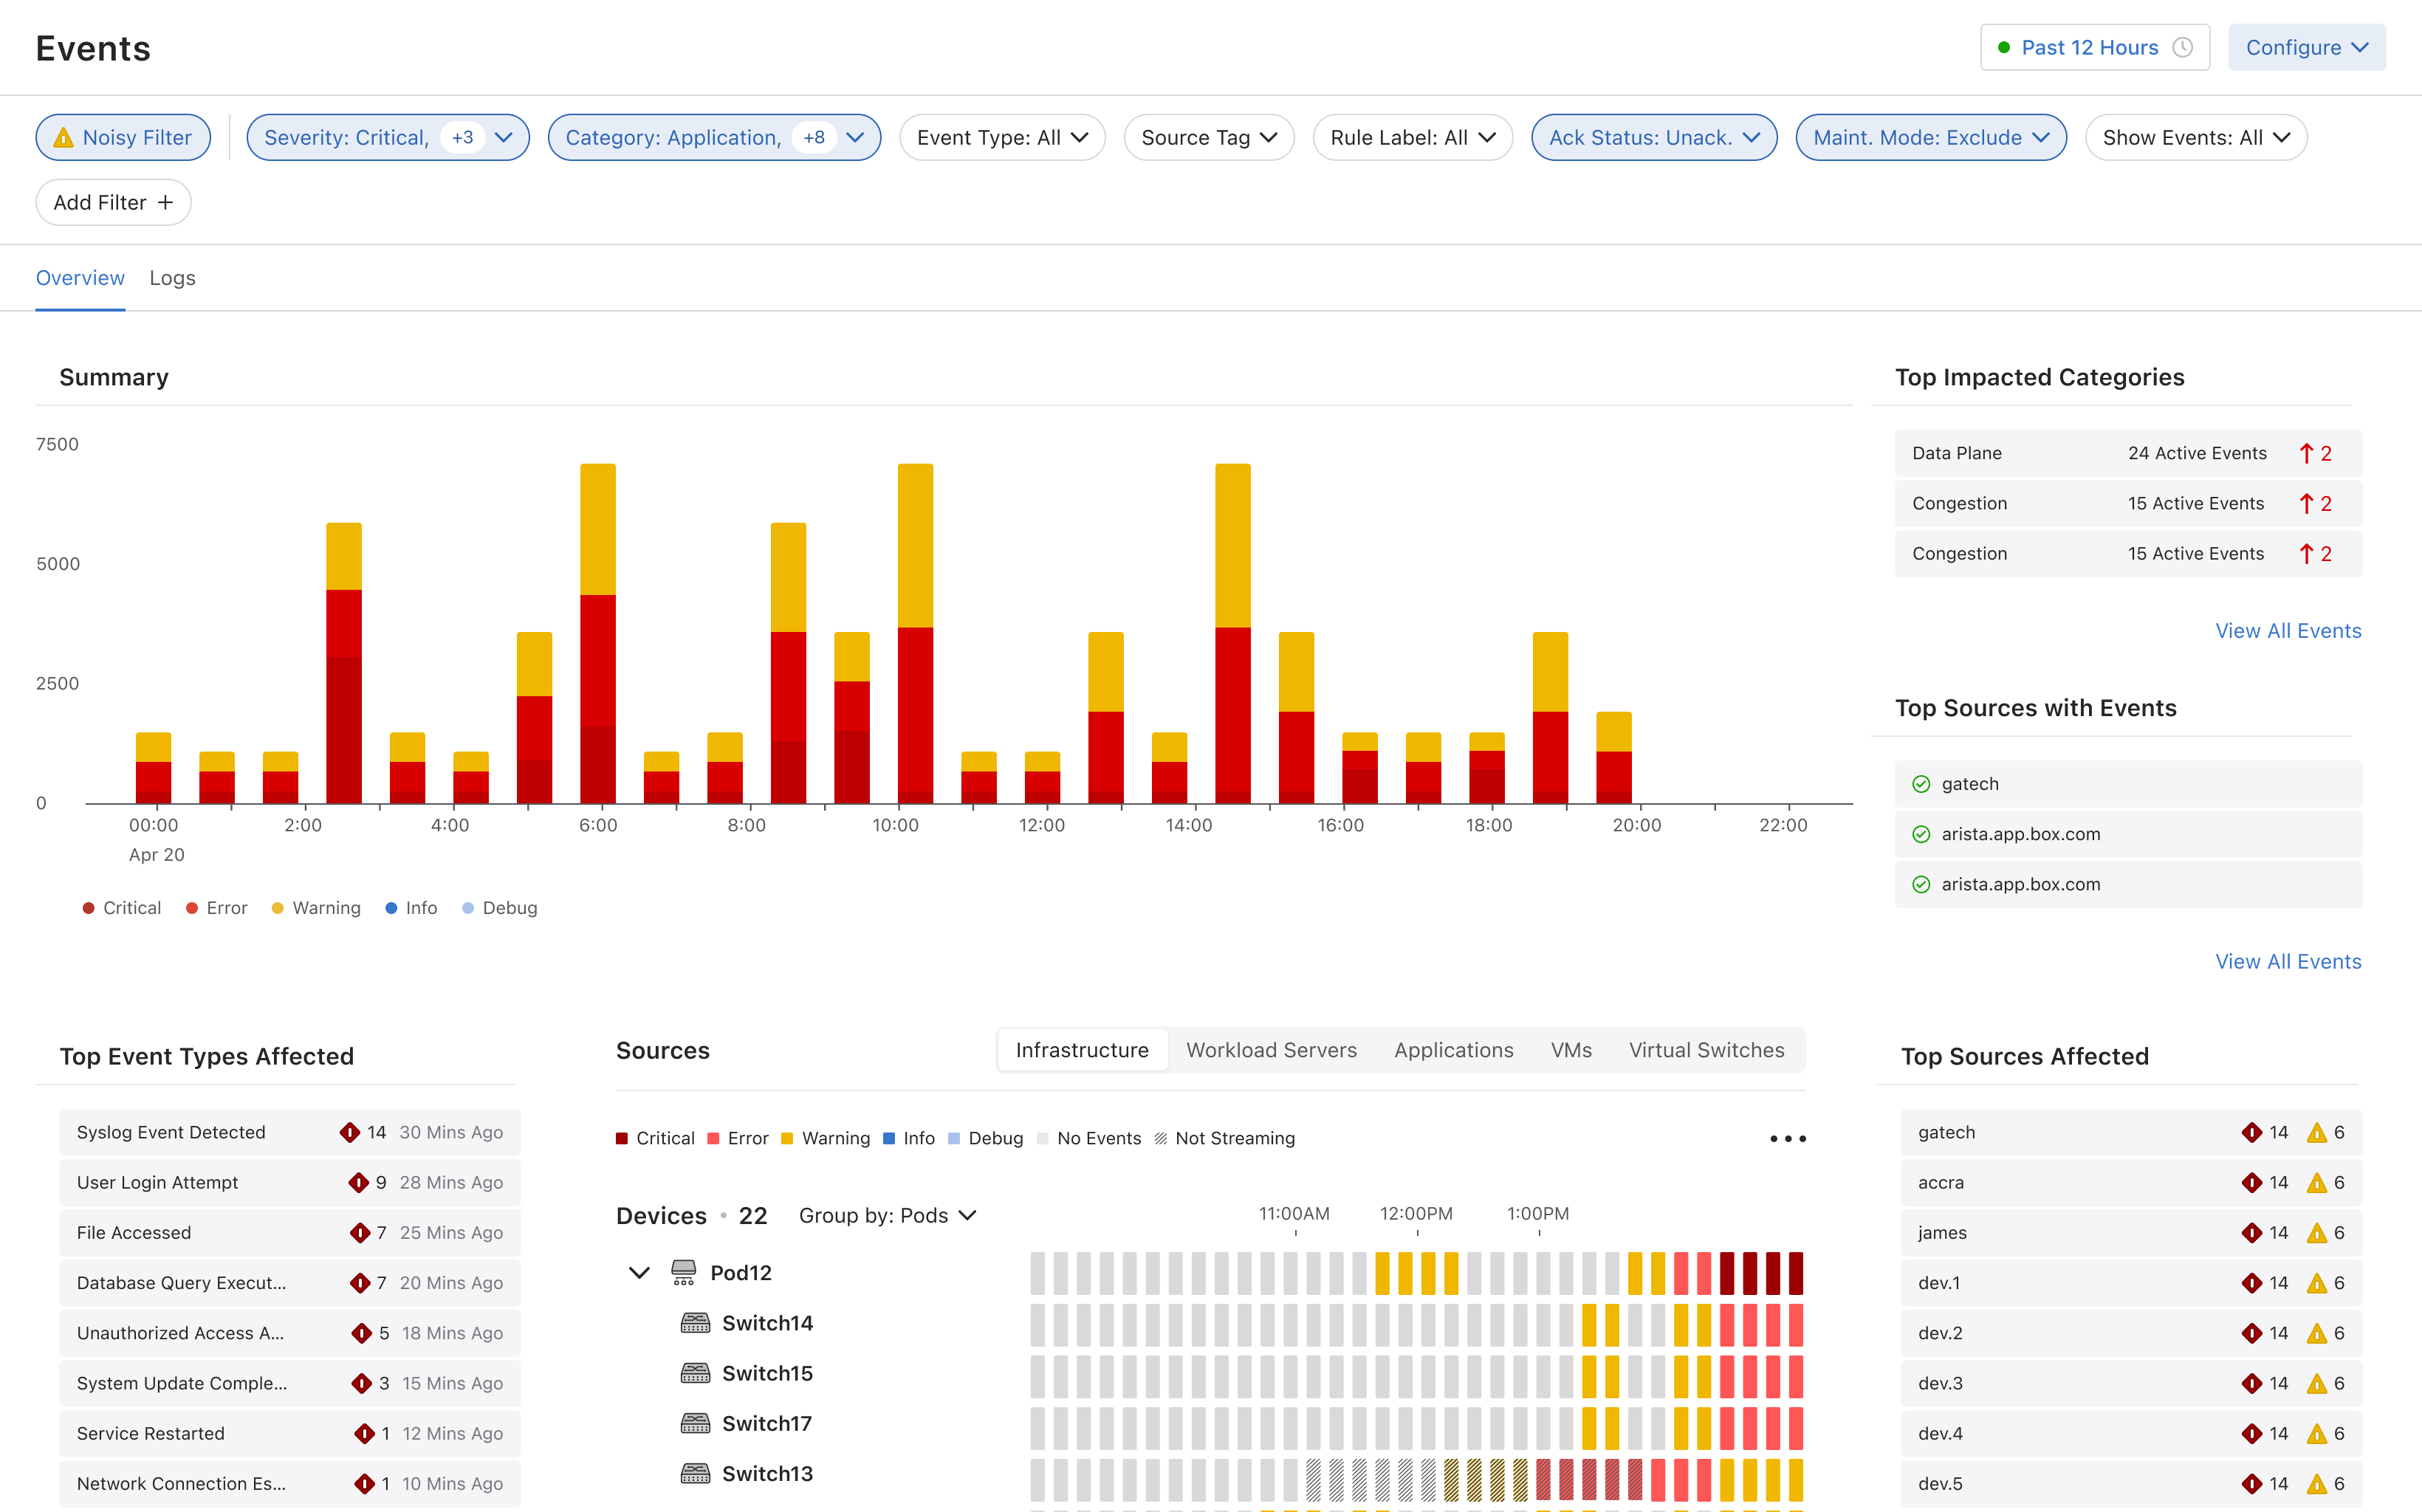
Version A and Version B kept the same underlying information but shifted it around, testing which existing data operators actually considered important, and how they reacted when familiar information moved to a different spot on the page.
Version A
Version B
05 · Stakeholder and Customer Feedback
Exploring AI to build predictive troubleshooting models.
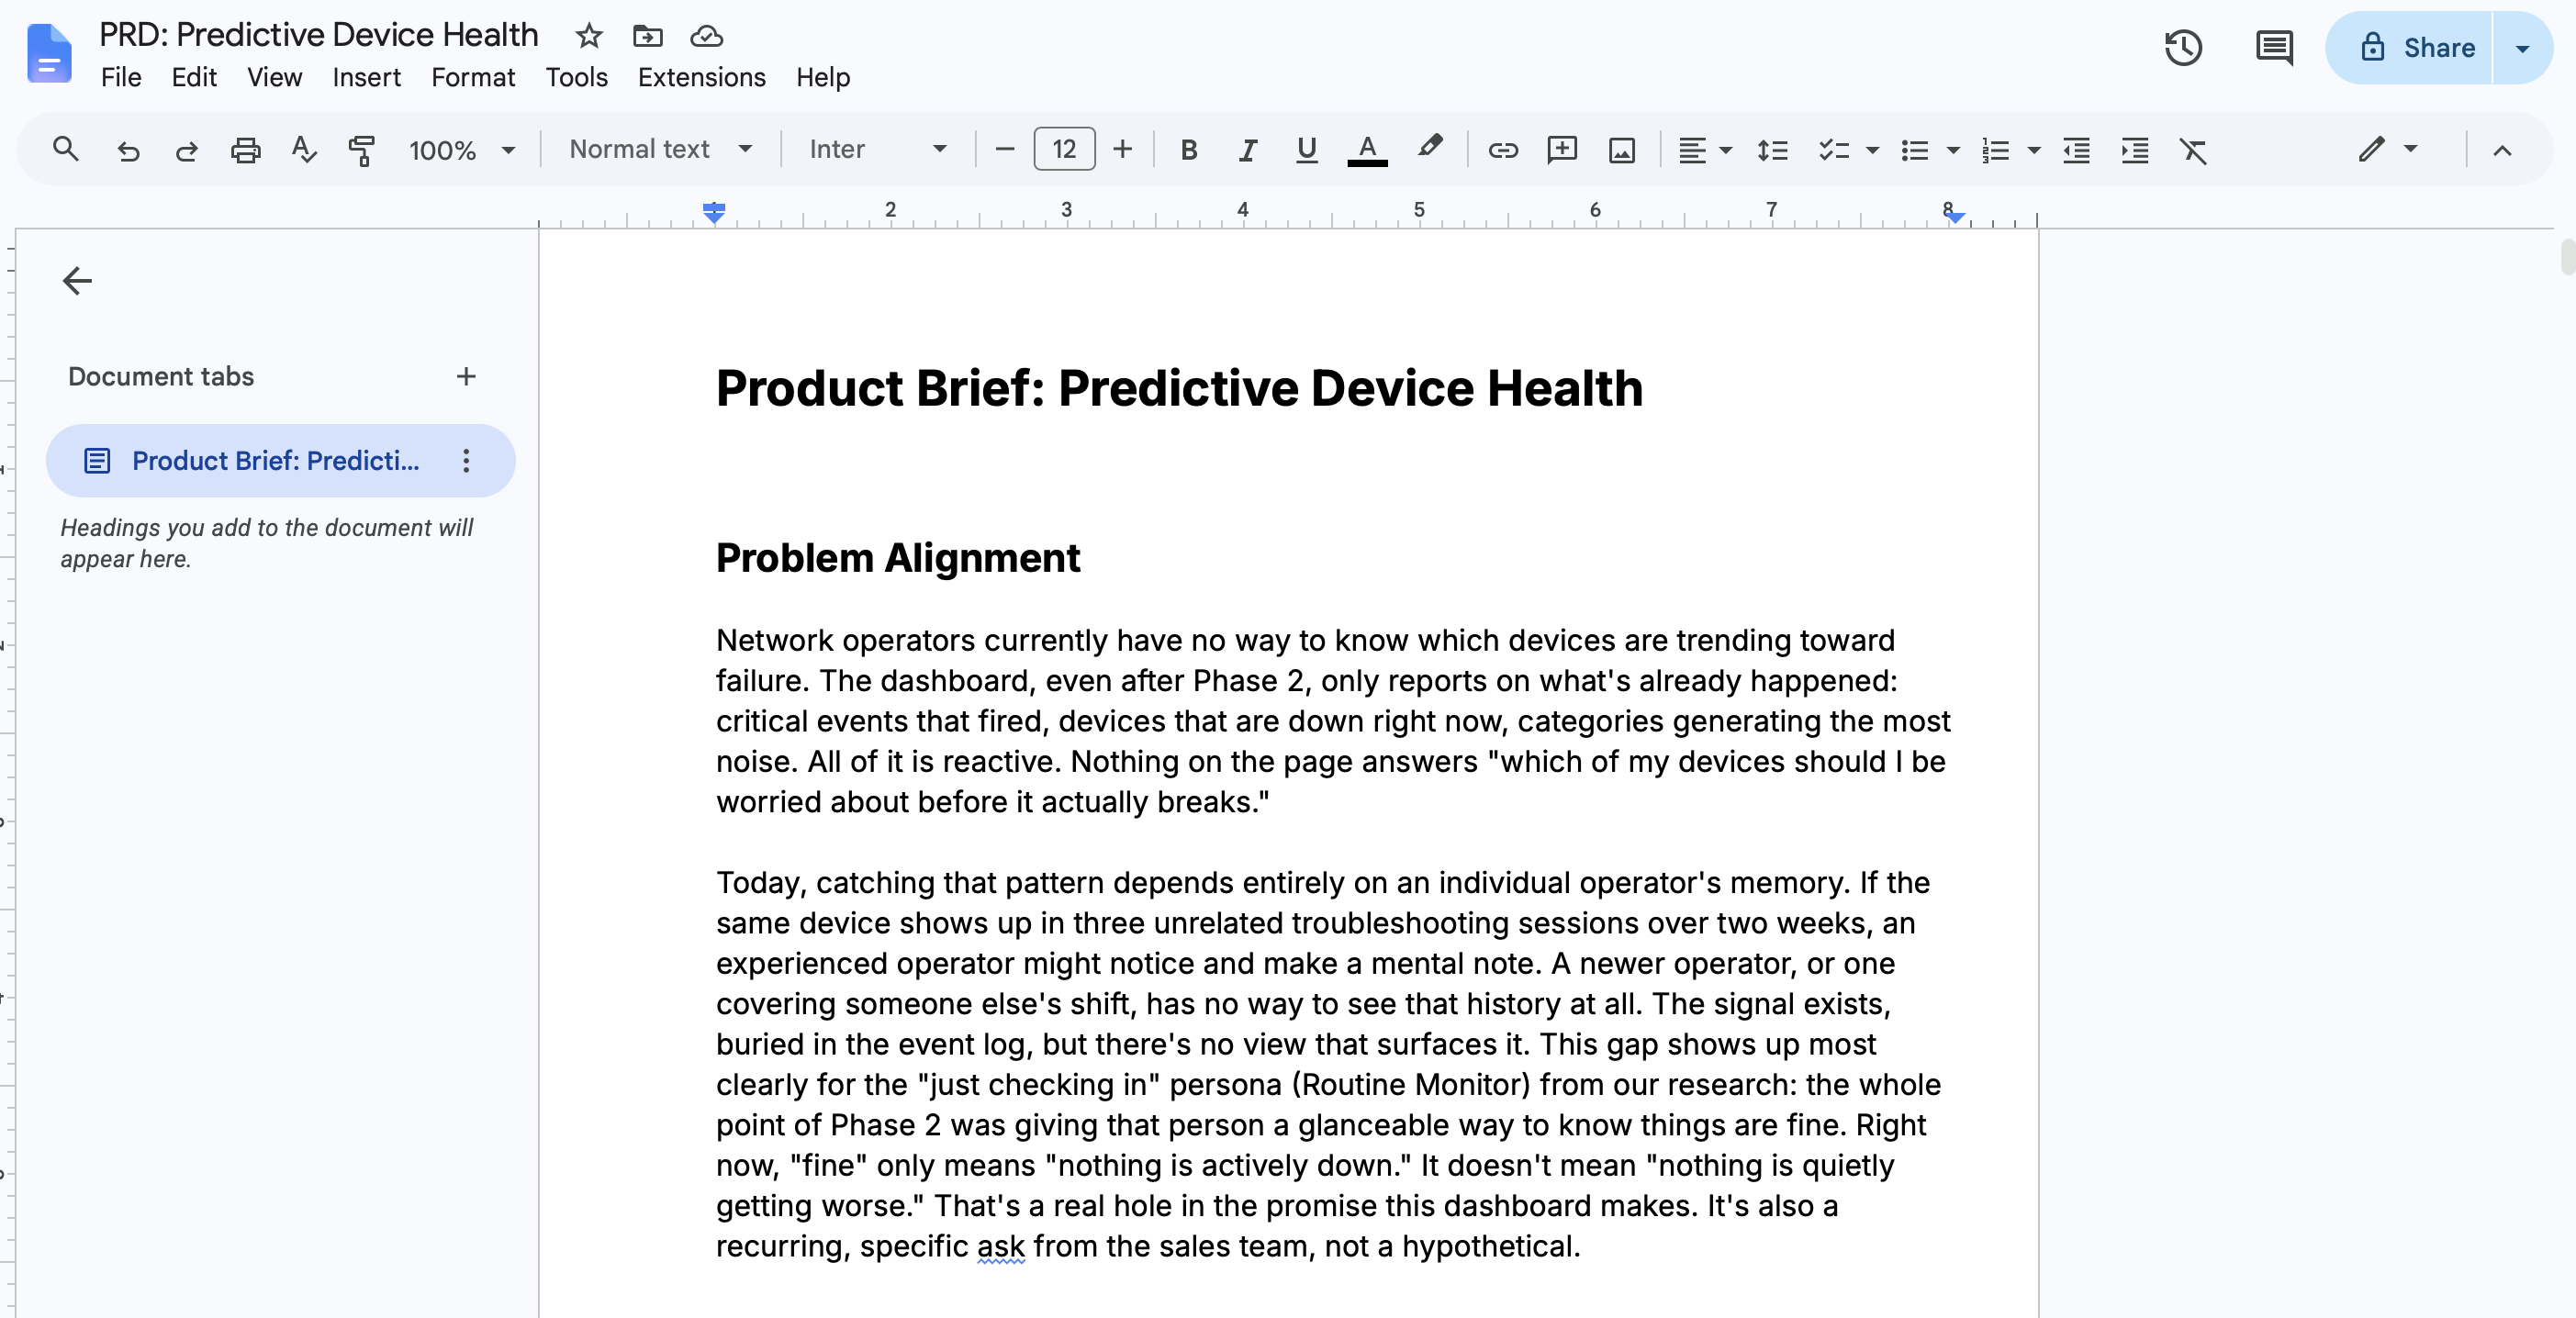
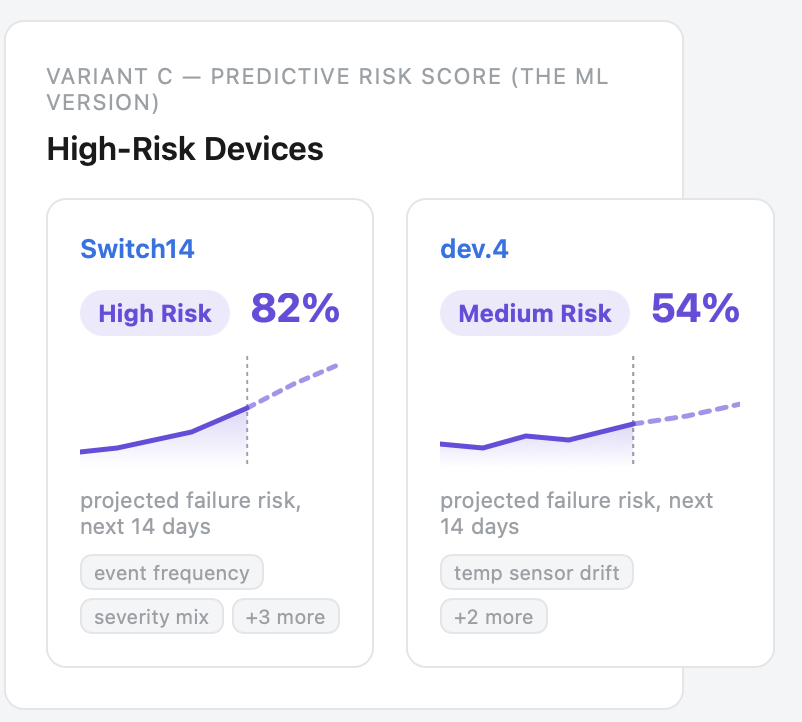
A common suggestion from stakeholders and sales was to use AI as a predictive metric somewhere on the dashboard, to flag potential trouble devices that wouldn't normally get flagged by the current system. I took the initiative to start the discussion, putting together a product brief and mocking up what that might look like. But we didn't have enough data yet, and the model itself wasn't set up, so we tabled it until the data catches up.
Product Brief — Predictive Device Health
Predictive Model Mockup
06 · Reflection
Aligning across teams and driving project direction.
Phase 2 shipped. Sales reported most customers found the new dashboard far more useful for spotting issues, and it became their starting point for triage instead of the old table. Doing the research up front meant the direction wasn't up for debate in review. The dashboard is now what operators land on when they open Events, with the detailed table still there for troubleshooting.
Phase 1 moved fast because it had to. I didn't have much research of my own, so I trusted the team's existing customer knowledge and kept scope tight. Phase 2 was different. I ran the research myself, and the direction came out of real conversations instead of what I was told to build. The AI brief was the clearest sign of that. Nobody asked for it. I wrote it, mocked it up, and then decided to table it when the data wasn't there yet instead of pushing it anyway. That's the part of this project I'm proudest of.
Next Project